Analytics Jobs

Analytics
UK

The table below provides summary statistics for permanent job vacancies requiring Analytics skills. It includes a benchmarking guide to the annual salaries offered in vacancies that cited Analytics over the 6 months leading up to 2 April 2025, comparing them to the same period in the previous two years.

6 months to
2 Apr 2025
Same period 2024 Same period 2023
Rank 26 38 24
Rank change year-on-year +12 -14 -1
Permanent jobs citing Analytics 3,455 5,141 9,957
As % of all permanent jobs advertised in the UK 6.84% 5.55% 9.00%
As % of the Processes & Methodologies category 7.31% 6.39% 9.41%
Number of salaries quoted 1,782 3,324 4,700
10th Percentile £37,500 £32,500 £37,500
25th Percentile £47,500 £42,725 £49,150
Median annual salary (50th Percentile) £67,500 £60,000 £65,133
Median % change year-on-year +12.50% -7.88% +0.20%
75th Percentile £92,500 £82,500 £87,500
90th Percentile £115,000 £107,500 £110,000
UK excluding London median annual salary £55,000 £53,500 £55,000
% change year-on-year +2.80% -2.73% +3.72%

All Process and Methodology Skills
UK

Analytics falls under the Processes and Methodologies category. For comparison with the information above, the following table provides summary statistics for all permanent job vacancies requiring process or methodology skills.

Permanent vacancies with a requirement for process or methodology skills 47,280 80,404 105,819
As % of all permanent jobs advertised in the UK 93.55% 86.78% 95.67%
Number of salaries quoted 25,837 58,088 61,888
10th Percentile £31,250 £29,250 £34,095
25th Percentile £44,000 £40,000 £45,000
Median annual salary (50th Percentile) £58,033 £55,000 £61,500
Median % change year-on-year +5.51% -10.57% +2.50%
75th Percentile £77,500 £73,250 £82,500
90th Percentile £98,750 £92,500 £100,000
UK excluding London median annual salary £52,600 £50,000 £54,590
% change year-on-year +5.20% -8.41% +3.98%

Analytics
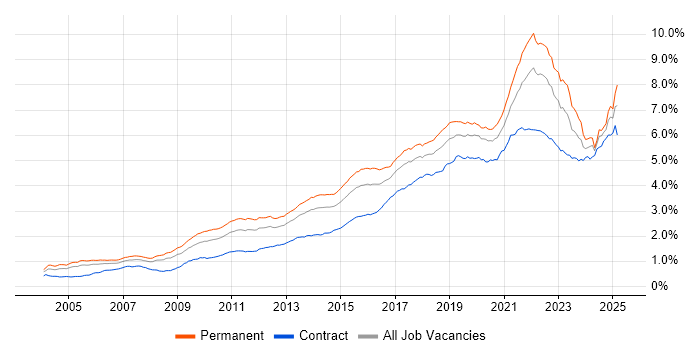
Job Vacancy Trend

Job postings citing Analytics as a proportion of all IT jobs advertised.

Job vacancy trend for Analytics in the UK

Analytics
Salary Trend

3-month moving average salary quoted in jobs citing Analytics.

Salary trend for Analytics in the UK

Analytics
Salary Histogram

Salary distribution for jobs citing Analytics over the 6 months to 2 April 2025.

Salary histogram for Analytics in the UK

Analytics
Top 18 Job Locations

The table below looks at the demand and provides a guide to the median salaries quoted in IT jobs citing Analytics within the UK over the 6 months to 2 April 2025. The 'Rank Change' column provides an indication of the change in demand within each location based on the same 6 month period last year.

Location Rank Change
on Same Period
Last Year
Matching
Permanent
IT Job Ads
Median Salary
Past 6 Months
Median Salary
% Change
on Same Period
Last Year
Live
Jobs
England +8 3,034 £70,000 +16.67% 6,573
UK excluding London +17 1,852 £55,000 +2.80% 2,407
London +3 1,446 £85,000 +13.33% 4,655
Work from Home +6 1,304 £60,743 +1.99% 3,090
North of England -6 477 £60,000 +20.00% 610
South East +22 465 £58,000 +0.87% 723
Midlands 0 338 £52,500 -4.24% 388
North West -5 333 £66,367 +27.42% 370
West Midlands -6 253 £55,000 +0.64% 256
Scotland +22 236 £52,000 -12.69% 187
South West +15 206 £51,500 -6.36% 207
Yorkshire -4 129 £55,000 +21.55% 176
East Midlands +26 85 £47,500 -13.64% 127
East of England +22 85 £65,000 +36.84% 217
Northern Ireland +38 32 £30,000 -52.00% 57
North East -17 19 £55,000 +10.00% 68
Wales -8 14 £50,000 +6.32% 50
Channel Islands +6 4 £78,750 -

Analytics
Co-occurring Skills and Capabilities by Category

The follow tables expand on the table above by listing co-occurrences grouped by category. The same employment type, locality and period is covered with up to 20 co-occurrences shown in each of the following categories:

Application Platforms
1 116 (3.36%) CMS
2 88 (2.55%) SAS
3 76 (2.20%) SharePoint
4 75 (2.17%) Apache Airflow
4 75 (2.17%) Oracle Application Server
5 64 (1.85%) Apache Spark
6 55 (1.59%) Apache
7 54 (1.56%) WordPress
8 25 (0.72%) Confluence
9 23 (0.67%) Drupal
10 20 (0.58%) Umbraco
11 12 (0.35%) IBM Domino
11 12 (0.35%) Microsoft Exchange
12 9 (0.26%) Adobe Experience Manager
13 8 (0.23%) IIS
14 7 (0.20%) Luigi
14 7 (0.20%) Sitecore CMS
15 4 (0.12%) ArcGIS
15 4 (0.12%) Jupyter
15 4 (0.12%) Mule
Applications
1 393 (11.37%) Microsoft Excel
2 94 (2.72%) Microsoft Office
3 82 (2.37%) Microsoft PowerPoint
4 27 (0.78%) Photoshop
5 24 (0.69%) Adobe Premiere
6 18 (0.52%) Trello
7 15 (0.43%) Chatbot
8 10 (0.29%) Adobe Creative Suite
8 10 (0.29%) Adobe Illustrator
8 10 (0.29%) Microsoft Project
9 9 (0.26%) InDesign
9 9 (0.26%) SPSS
10 6 (0.17%) Maya
10 6 (0.17%) MS Visio
11 5 (0.14%) Spreadsheet
12 4 (0.12%) Oracle Smart View
12 4 (0.12%) Weka
13 3 (0.087%) Adobe XD
14 2 (0.058%) Notion
14 2 (0.058%) Sketch
Business Applications
1 65 (1.88%) Shopify
2 40 (1.16%) NetSuite
3 31 (0.90%) Aladdin
4 21 (0.61%) SAP S/4HANA
5 20 (0.58%) Dynamics CRM
6 18 (0.52%) Dynamics AX
7 16 (0.46%) Oracle ERP
8 11 (0.32%) IBM Planning Analytics
9 9 (0.26%) Oracle EBS
10 7 (0.20%) Salesforce CRM
11 6 (0.17%) Infor M3
11 6 (0.17%) Oracle Retail
11 6 (0.17%) PeopleSoft HCM
12 5 (0.14%) CiviCRM
12 5 (0.14%) Relativity
13 4 (0.12%) Infor LN
13 4 (0.12%) iTrent
14 3 (0.087%) Payment Gateway
14 3 (0.087%) SAP FI
14 3 (0.087%) Sprinklr
Cloud Services
1 786 (22.75%) Azure
2 659 (19.07%) Power Platform
3 504 (14.59%) AWS
4 272 (7.87%) Google Analytics
5 269 (7.79%) GCP
6 154 (4.46%) Azure Synapse Analytics
7 145 (4.20%) Azure Data Factory
8 144 (4.17%) Snowflake
9 125 (3.62%) SaaS
10 107 (3.10%) Google Ads
11 106 (3.07%) Serverless
12 84 (2.43%) dbt
13 83 (2.40%) Azure DevOps
14 78 (2.26%) Amazon S3
15 77 (2.23%) GitHub
16 75 (2.17%) Microsoft 365
17 69 (2.00%) AWS Lambda
18 54 (1.56%) Google Tag Manager
18 54 (1.56%) PaaS
19 49 (1.42%) Power Automate
Communications & Networking
1 36 (1.04%) Firewall
2 34 (0.98%) Internet
3 32 (0.93%) DNS
4 30 (0.87%) Broadband
5 22 (0.64%) VPN
6 18 (0.52%) Network Security
7 16 (0.46%) Wi-Fi
8 12 (0.35%) HTTP
9 11 (0.32%) Intranet
9 11 (0.32%) TCP/IP
10 10 (0.29%) Intrusion Detection
11 9 (0.26%) SMS
12 6 (0.17%) Bluetooth
12 6 (0.17%) DHCP
12 6 (0.17%) LAN
13 5 (0.14%) SSL
14 4 (0.12%) Kerberos
14 4 (0.12%) SAN
14 4 (0.12%) WAN
15 3 (0.087%) Wireless
Database & Business Intelligence
1 648 (18.76%) Power BI
2 369 (10.68%) Data Warehouse
3 357 (10.33%) Tableau
4 207 (5.99%) Data Lake
5 202 (5.85%) Big Data
6 131 (3.79%) SQL Server
7 95 (2.75%) Oracle Reports
8 92 (2.66%) NoSQL
9 90 (2.60%) Enterprise Data Warehouse
10 73 (2.11%) BigQuery
10 73 (2.11%) SQL Server Integration Services
11 72 (2.08%) Relational Database
12 67 (1.94%) Amazon Redshift
12 67 (1.94%) Data Mining
13 65 (1.88%) Metadata
14 56 (1.62%) SQL Server Reporting Services
15 55 (1.59%) Amazon Athena
15 55 (1.59%) Azure SQL Database
16 50 (1.45%) Looker
17 45 (1.30%) Hadoop
Development Applications
1 163 (4.72%) Git
2 110 (3.18%) JIRA
3 73 (2.11%) Jenkins
4 34 (0.98%) GitLab
5 29 (0.84%) Eclipse
5 29 (0.84%) Eclipse RCP
6 19 (0.55%) JUnit
6 19 (0.55%) SQL Server Management Studio (SSMS)
7 17 (0.49%) Maven
8 16 (0.46%) Cucumber
9 15 (0.43%) Mockito
10 14 (0.41%) IntelliJ
11 13 (0.38%) MLflow
12 12 (0.35%) Selenium
13 10 (0.29%) CircleCI
13 10 (0.29%) Visual Studio
13 10 (0.29%) webpack
14 9 (0.26%) ERwin
15 6 (0.17%) Babel
15 6 (0.17%) Terragrunt
General
1 1,334 (38.61%) Finance
2 1,301 (37.66%) Social Skills
3 967 (27.99%) Analytical Skills
4 537 (15.54%) Marketing
5 388 (11.23%) Banking
6 339 (9.81%) Law
7 318 (9.20%) Retail
8 229 (6.63%) Inclusion and Diversity
9 200 (5.79%) Organisational Skills
10 159 (4.60%) Legal
11 144 (4.17%) Presentation Skills
12 129 (3.73%) Front Office
13 127 (3.68%) Advertising
14 122 (3.53%) Public Sector
15 117 (3.39%) Manufacturing
16 93 (2.69%) Games
17 92 (2.66%) Telecoms
18 87 (2.52%) Influencing Skills
19 79 (2.29%) Military
20 46 (1.33%) Pharmaceutical
Job Titles
1 663 (19.19%) Analyst
2 654 (18.93%) Senior
3 462 (13.37%) Lead
4 258 (7.47%) Data Analyst
5 254 (7.35%) Data Engineer
6 231 (6.69%) Developer
7 213 (6.16%) Architect
8 150 (4.34%) Senior Analyst
9 149 (4.31%) Data Scientist
10 112 (3.24%) Software Engineer
11 102 (2.95%) Data Manager
11 102 (2.95%) Solutions Architect
12 99 (2.87%) Senior Manager
13 97 (2.81%) Product Manager
14 83 (2.40%) Analytics Manager
15 82 (2.37%) Consultant
16 79 (2.29%) Digital Analyst
17 70 (2.03%) Business Analyst
18 69 (2.00%) Data Architect
19 63 (1.82%) Senior Data Engineer
Libraries, Frameworks & Software Standards
1 150 (4.34%) CSS
2 143 (4.14%) HTML
3 103 (2.98%) NumPy
4 101 (2.92%) Pandas
5 92 (2.66%) PySpark
6 89 (2.58%) Kafka
6 89 (2.58%) React
7 64 (1.85%) RESTful
8 59 (1.71%) PyTorch
9 55 (1.59%) SciPy
10 52 (1.51%) Middleware
11 47 (1.36%) TensorFlow
12 41 (1.19%) .NET
13 39 (1.13%) scikit-learn
14 38 (1.10%) AngularJS
15 36 (1.04%) Node.js
16 33 (0.96%) JSON
17 29 (0.84%) JSP
17 29 (0.84%) OAuth
18 28 (0.81%) REST
Miscellaneous
1 242 (7.00%) Algorithms
2 229 (6.63%) Product Ownership
3 203 (5.88%) Management Information System
4 191 (5.53%) Social Media
5 86 (2.49%) Robotics
6 82 (2.37%) Fixed Income
7 74 (2.14%) Hedge funds
8 69 (2.00%) Cloud Native
9 65 (1.88%) Blockchain
9 65 (1.88%) Credit Risk
10 64 (1.85%) Derivative
11 63 (1.82%) Enterprise Software
12 61 (1.77%) Data Structures
13 57 (1.65%) Analytical Mindset
14 52 (1.51%) Self-Motivation
15 49 (1.42%) Equities
16 47 (1.36%) Blog
17 46 (1.33%) FMCG
18 45 (1.30%) Mobile App
19 43 (1.24%) Public Cloud
Operating Systems
1 124 (3.59%) Windows
2 114 (3.30%) Linux
3 38 (1.10%) Apple iOS
4 29 (0.84%) Windows Server
5 16 (0.46%) Windows Vista
6 11 (0.32%) Android
6 11 (0.32%) Ubuntu
7 10 (0.29%) Unix
7 10 (0.29%) Windows 10
8 7 (0.20%) Mac OS
9 6 (0.17%) Windows Server 2016
10 4 (0.12%) AIX
10 4 (0.12%) Red Hat Enterprise Linux
10 4 (0.12%) Windows Server 2019
11 3 (0.087%) VMS
12 2 (0.058%) Oracle Linux
12 2 (0.058%) Windows Server 2012
13 1 (0.029%) CentOS
13 1 (0.029%) Rocky
13 1 (0.029%) zOS
Processes & Methodologies
1 859 (24.86%) Data Analytics
2 845 (24.46%) Business Intelligence
3 836 (24.20%) Agile
4 751 (21.74%) Problem-Solving
5 721 (20.87%) Artificial Intelligence
6 681 (19.71%) Decision-Making
7 656 (18.99%) Visualisation
8 546 (15.80%) Data Science
9 488 (14.12%) Data Management
10 481 (13.92%) Roadmaps
11 470 (13.60%) Data Modelling
12 466 (13.49%) Machine Learning
13 439 (12.71%) Data Analysis
14 421 (12.19%) Mentoring
15 418 (12.10%) DevOps
16 394 (11.40%) Computer Science
17 387 (11.20%) Data Engineering
18 374 (10.82%) Stakeholder Management
19 357 (10.33%) ETL
20 339 (9.81%) Continuous Improvement
Programming Languages
1 1,023 (29.61%) SQL
2 985 (28.51%) Python
3 235 (6.80%) Java
4 149 (4.31%) JavaScript
5 137 (3.97%) R
6 123 (3.56%) C#
7 71 (2.05%) PowerShell
8 67 (1.94%) C++
9 65 (1.88%) Data Analysis Expressions
10 62 (1.79%) T-SQL
11 47 (1.36%) Scala
12 41 (1.19%) TypeScript
13 34 (0.98%) Bash
14 29 (0.84%) C
15 25 (0.72%) Rust
16 24 (0.69%) PHP
17 23 (0.67%) Ada
18 22 (0.64%) VBA
19 18 (0.52%) Go
20 17 (0.49%) MATLAB
Qualifications
1 1,073 (31.06%) Degree
2 222 (6.43%) Master's Degree
3 185 (5.35%) DBS Check
4 148 (4.28%) Security Cleared
5 136 (3.94%) Computer Science Degree
6 106 (3.07%) PhD
7 86 (2.49%) SC Cleared
8 62 (1.79%) Numerate Degree
9 59 (1.71%) Azure Certification
10 58 (1.68%) BPSS Clearance
11 54 (1.56%) DV Cleared
12 42 (1.22%) CISA
13 35 (1.01%) AWS Certification
14 34 (0.98%) CIMA
15 33 (0.96%) ACCA
16 21 (0.61%) Microsoft Certification
17 20 (0.58%) CISSP
18 19 (0.55%) MBA
19 18 (0.52%) ISACA
20 13 (0.38%) CISM
Quality Assurance & Compliance
1 344 (9.96%) Data Quality
2 139 (4.02%) Accessibility
3 112 (3.24%) GDPR
4 60 (1.74%) QA
5 41 (1.19%) ITGC
6 30 (0.87%) Actionable Recommendations
7 24 (0.69%) IFRS
8 22 (0.64%) Sarbanes-Oxley
9 21 (0.61%) ISO/IEC 27001
10 20 (0.58%) IFRS 9
11 19 (0.55%) SLA
12 17 (0.49%) California Consumer Privacy Act
12 17 (0.49%) HIPAA
12 17 (0.49%) SOC 2
13 13 (0.38%) PCI DSS
14 10 (0.29%) Basel III
15 9 (0.26%) PMO
16 8 (0.23%) Cyber Essentials
16 8 (0.23%) NIST
17 7 (0.20%) Dodd-Frank
System Software
1 118 (3.42%) Docker
2 45 (1.30%) Active Directory
3 35 (1.01%) Virtual Machines
4 20 (0.58%) VMware Infrastructure
5 12 (0.35%) Hyper-V
6 9 (0.26%) Virtual Desktop
7 4 (0.12%) HDFS
7 4 (0.12%) vSphere
8 2 (0.058%) BitLocker
8 2 (0.058%) VMware ESXi
9 1 (0.029%) Firmware
9 1 (0.029%) Job Entry Subsystem
9 1 (0.029%) Microsoft App-V
9 1 (0.029%) Time Sharing Option
9 1 (0.029%) Virtual Servers
9 1 (0.029%) VMware Workstation
9 1 (0.029%) XenApp
9 1 (0.029%) XenDesktop
Systems Management
1 157 (4.54%) Kubernetes
2 143 (4.14%) Terraform
3 53 (1.53%) Ansible
4 24 (0.69%) Prometheus
5 19 (0.55%) Grafana
5 19 (0.55%) Single Sign-On
6 15 (0.43%) Microsoft Intune
7 9 (0.26%) SCCM
8 8 (0.23%) ZABBIX
9 6 (0.17%) Graylog
10 4 (0.12%) FortiGate
10 4 (0.12%) Kubeflow
10 4 (0.12%) Matomo
10 4 (0.12%) QRadar
11 3 (0.087%) Argo
11 3 (0.087%) Systems Management Server (SMS)
12 2 (0.058%) Active Directory Federation Services
12 2 (0.058%) FTK
12 2 (0.058%) Hadoop YARN
12 2 (0.058%) Istio
Vendors
1 664 (19.22%) Microsoft
2 434 (12.56%) Google
3 296 (8.57%) Databricks
4 190 (5.50%) Oracle
5 176 (5.09%) SAP
6 144 (4.17%) Salesforce
7 94 (2.72%) Adobe
8 92 (2.66%) Alteryx
9 63 (1.82%) ServiceNow
10 61 (1.77%) Facebook
11 60 (1.74%) Instagram
12 48 (1.39%) TikTok
13 47 (1.36%) IBM
14 36 (1.04%) Pinterest
15 30 (0.87%) VMware
16 26 (0.75%) Ahrefs
16 26 (0.75%) YouTube
17 25 (0.72%) OpenAI
18 24 (0.69%) Informatica
19 21 (0.61%) BISAM