Project Management Jobs

Project Management
UK

The table below provides summary statistics for permanent job vacancies requiring Project Management skills. It includes a benchmarking guide to the annual salaries offered in vacancies that cited Project Management over the 6 months leading up to 21 December 2024, comparing them to the same period in the previous two years.

6 months to
21 Dec 2024
Same period 2023 Same period 2022
Rank 16 26 25
Rank change year-on-year +10 -1 +11
Permanent jobs citing Project Management 6,140 4,106 10,236
As % of all permanent jobs advertised in the UK 9.20% 7.97% 8.70%
As % of the Processes & Methodologies category 10.12% 8.48% 9.09%
Number of salaries quoted 2,810 2,662 5,698
10th Percentile £37,500 £36,750 £37,500
25th Percentile £46,250 £46,250 £46,250
Median annual salary (50th Percentile) £56,000 £60,000 £59,000
Median % change year-on-year -6.67% +1.69% +7.27%
75th Percentile £70,000 £72,500 £75,000
90th Percentile £85,000 £88,750 £90,000
UK excluding London median annual salary £55,000 £55,000 £52,500
% change year-on-year - +4.76% +5.00%

All Process and Methodology Skills
UK

Project Management falls under the Processes and Methodologies category. For comparison with the information above, the following table provides summary statistics for all permanent job vacancies requiring process or methodology skills.

Permanent vacancies with a requirement for process or methodology skills 60,644 48,444 112,598
As % of all permanent jobs advertised in the UK 90.90% 94.08% 95.75%
Number of salaries quoted 27,354 34,872 70,428
10th Percentile £35,000 £32,000 £34,750
25th Percentile £45,000 £43,750 £45,058
Median annual salary (50th Percentile) £60,000 £60,000 £61,757
Median % change year-on-year - -2.84% +2.93%
75th Percentile £78,750 £80,000 £82,500
90th Percentile £97,500 £100,000 £100,000
UK excluding London median annual salary £54,793 £52,500 £54,000
% change year-on-year +4.37% -2.78% +8.00%

Project Management
Job Vacancy Trend

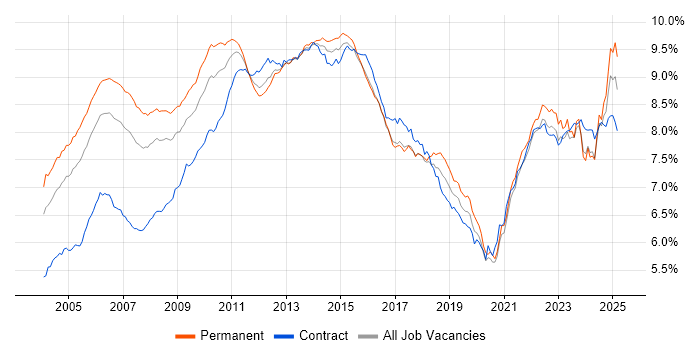
Job postings citing Project Management as a proportion of all IT jobs advertised.

Job vacancy trend for Project Management in the UK

Project Management
Salary Trend

3-month moving average salary quoted in jobs citing Project Management.

Salary trend for Project Management in the UK

Project Management
Salary Histogram

Salary distribution for jobs citing Project Management over the 6 months to 21 December 2024.

Salary histogram for Project Management in the UK

Project Management
Top 19 Job Locations

The table below looks at the demand and provides a guide to the median salaries quoted in IT jobs citing Project Management within the UK over the 6 months to 21 December 2024. The 'Rank Change' column provides an indication of the change in demand within each location based on the same 6 month period last year.

Location Rank Change
on Same Period
Last Year
Matching
Permanent
IT Job Ads
Median Salary
Past 6 Months
Median Salary
% Change
on Same Period
Last Year
Live
Jobs
England +7 5,510 £56,504 -5.83% 1,724
UK excluding London +16 4,541 £55,000 - 1,101
Work from Home -1 1,551 £60,000 +3.45% 1,303
London +1 1,375 £67,500 -2.53% 724
North of England +25 1,357 £56,000 +1.82% 274
Midlands +13 1,060 £55,000 - 187
North West +25 1,023 £56,000 - 160
South East +3 903 £56,500 +2.73% 270
West Midlands +6 524 £57,500 +4.55% 114
East Midlands +25 519 £52,250 -3.24% 73
East of England +11 407 £52,000 -9.57% 135
South West +3 371 £52,000 +0.97% 139
Scotland +20 291 £53,086 -3.48% 62
Yorkshire +3 244 £55,000 - 84
Wales +12 102 £50,000 +3.04% 35
North East +1 90 £52,000 -0.95% 33
Northern Ireland +21 44 £67,500 +17.39% 29
Channel Islands - 7 £50,000 -
Isle of Man - 3 £43,000 - 1

Project Management
Co-occurring Skills and Capabilities by Category

The follow tables expand on the table above by listing co-occurrences grouped by category. The same employment type, locality and period is covered with up to 20 co-occurrences shown in each of the following categories:

Application Platforms
1 234 (3.81%) SharePoint
2 93 (1.51%) Confluence
3 80 (1.30%) CMS
4 70 (1.14%) Microsoft Exchange
5 54 (0.88%) WordPress
6 26 (0.42%) Apache Spark
7 22 (0.36%) Apache
8 19 (0.31%) Kentico
8 19 (0.31%) SAS
9 17 (0.28%) OpenStack
10 14 (0.23%) CloudStack
11 13 (0.21%) Apache Airflow
12 12 (0.20%) Umbraco
13 10 (0.16%) ArcGIS
14 8 (0.13%) Moodle
14 8 (0.13%) Sitecore CMS
14 8 (0.13%) Sitefinity
15 7 (0.11%) nginx
16 6 (0.098%) Drupal
17 5 (0.081%) TPMS
Applications
1 441 (7.18%) Microsoft Office
2 386 (6.29%) Microsoft Excel
3 261 (4.25%) Microsoft Project
4 144 (2.35%) Microsoft PowerPoint
5 53 (0.86%) AutoCAD
6 48 (0.78%) MS Visio
7 42 (0.68%) Trello
8 29 (0.47%) Simulink
9 18 (0.29%) Adobe Creative Suite
10 16 (0.26%) Spreadsheet
11 14 (0.23%) Chatbot
12 10 (0.16%) Photoshop
12 10 (0.16%) SketchUp
13 9 (0.15%) Adobe Premiere
14 8 (0.13%) InDesign
15 7 (0.11%) Adobe Illustrator
15 7 (0.11%) Adobe XD
15 7 (0.11%) InVision
16 6 (0.098%) Revit
16 6 (0.098%) Sketch
Business Applications
1 77 (1.25%) SAP S/4HANA
2 50 (0.81%) NetSuite
3 45 (0.73%) Dynamics CRM
4 36 (0.59%) Teamcenter
5 34 (0.55%) Shopify
6 26 (0.42%) Oracle ERP
7 19 (0.31%) NEC Housing
8 17 (0.28%) Oracle EBS
9 15 (0.24%) HFM
9 15 (0.24%) Maximo
9 15 (0.24%) Oracle Payables
9 15 (0.24%) Oracle Receivables
10 12 (0.20%) Oracle General Ledger
10 12 (0.20%) SAP SD
11 11 (0.18%) Oracle Assets
11 11 (0.18%) Oracle Cash Management
12 10 (0.16%) Dynamics NAV
12 10 (0.16%) Oracle Retail
13 9 (0.15%) Payment Gateway
14 8 (0.13%) Odoo
Cloud Services
1 539 (8.78%) Azure
2 308 (5.02%) Microsoft 365
3 282 (4.59%) AWS
4 218 (3.55%) Power Platform
5 198 (3.22%) SaaS
6 111 (1.81%) Azure DevOps
7 103 (1.68%) GCP
8 94 (1.53%) GitHub
9 77 (1.25%) Dynamics 365
9 77 (1.25%) Entra ID
10 53 (0.86%) Cloud Computing
11 48 (0.78%) Power Automate
12 46 (0.75%) PowerApps
13 41 (0.67%) IaaS
14 39 (0.64%) PaaS
15 34 (0.55%) Slack
16 32 (0.52%) Snowflake
17 28 (0.46%) Zapier
18 26 (0.42%) Smartsheet
19 25 (0.41%) OCI
Communications & Networking
1 105 (1.71%) Firewall
2 75 (1.22%) DNS
3 70 (1.14%) DHCP
4 62 (1.01%) WAN
5 60 (0.98%) VPN
6 54 (0.88%) TCP/IP
7 49 (0.80%) Network Security
8 41 (0.67%) Broadband
9 38 (0.62%) Wi-Fi
10 33 (0.54%) Internet
10 33 (0.54%) LAN
11 28 (0.46%) Intranet
12 26 (0.42%) SD-WAN
12 26 (0.42%) Structured Cabling
13 24 (0.39%) Wireless
14 23 (0.37%) Unified Communications
15 22 (0.36%) VLAN
16 16 (0.26%) BGP
16 16 (0.26%) OSPF
16 16 (0.26%) VoIP
Database & Business Intelligence
1 196 (3.19%) SQL Server
2 139 (2.26%) Power BI
3 66 (1.07%) SQL Server Reporting Services
4 64 (1.04%) Big Data
5 56 (0.91%) Azure SQL Database
5 56 (0.91%) MySQL
6 44 (0.72%) Tableau
7 42 (0.68%) Data Warehouse
8 33 (0.54%) Data Mining
9 28 (0.46%) DTS
9 28 (0.46%) Relational Database
10 26 (0.42%) NoSQL
11 23 (0.37%) Electronic Patient Records
11 23 (0.37%) PostgreSQL
12 22 (0.36%) SQL Server Integration Services
13 20 (0.33%) MS Access
14 15 (0.24%) Amazon Redshift
15 14 (0.23%) Snowflake Schema
16 13 (0.21%) BigQuery
17 12 (0.20%) Hadoop
Development Applications
1 272 (4.43%) JIRA
2 109 (1.78%) Git
3 40 (0.65%) Visual Studio
4 36 (0.59%) Bitbucket
5 32 (0.52%) Rational DOORS
6 23 (0.37%) Jenkins
7 17 (0.28%) SonarQube
8 12 (0.20%) GitLab
9 9 (0.15%) SQL Server Management Studio (SSMS)
10 8 (0.13%) Cucumber
10 8 (0.13%) Cypress.io
11 6 (0.098%) Artifactory
11 6 (0.098%) Rational Rhapsody
12 5 (0.081%) LabVIEW
13 4 (0.065%) Ant
13 4 (0.065%) Grunt
13 4 (0.065%) LSMW
13 4 (0.065%) Selenium
13 4 (0.065%) Subversion
13 4 (0.065%) webpack
General
1 2,469 (40.21%) Social Skills
2 1,899 (30.93%) Finance
3 882 (14.36%) Analytical Skills
4 466 (7.59%) Manufacturing
5 349 (5.68%) Retail
6 347 (5.65%) Organisational Skills
7 339 (5.52%) Marketing
8 305 (4.97%) Legal
9 295 (4.80%) Public Sector
10 248 (4.04%) Inclusion and Diversity
11 244 (3.97%) Law
12 189 (3.08%) Influencing Skills
13 186 (3.03%) Banking
14 174 (2.83%) Presentation Skills
15 103 (1.68%) Telecoms
16 102 (1.66%) Pharmaceutical
17 100 (1.63%) Local Government
18 94 (1.53%) Aerospace
19 88 (1.43%) Electronics
20 73 (1.19%) Automotive
Job Titles
1 2,429 (39.56%) Project Manager
2 930 (15.15%) Senior
3 583 (9.50%) Senior Manager
4 444 (7.23%) Analyst
5 423 (6.89%) Senior Project Manager
6 407 (6.63%) Lead
7 337 (5.49%) IT Manager
8 228 (3.71%) Developer
9 217 (3.53%) Consultant
10 175 (2.85%) IT Project Manager
11 153 (2.49%) Delivery Project Manager
12 143 (2.33%) Architect
12 143 (2.33%) Delivery Manager
13 136 (2.21%) Technical Manager
14 132 (2.15%) Audit Manager
15 122 (1.99%) Programme Manager
16 110 (1.79%) Principal Engineer
17 109 (1.78%) Development Manager
18 104 (1.69%) Business Analyst
19 102 (1.66%) Service Manager
Libraries, Frameworks & Software Standards
1 178 (2.90%) .NET
2 154 (2.51%) HTML
3 126 (2.05%) CSS
4 98 (1.60%) .NET Framework
5 75 (1.22%) React
6 67 (1.09%) ASP.NET
6 67 (1.09%) XML
7 58 (0.94%) HTML5
8 54 (0.88%) .NET Core
9 41 (0.67%) JSON
10 34 (0.55%) Entity Framework
10 34 (0.55%) Sass
11 32 (0.52%) Laravel
12 29 (0.47%) CSS3
13 28 (0.46%) AngularJS
14 27 (0.44%) ASP.NET Core
15 25 (0.41%) LESS
16 23 (0.37%) Kafka
16 23 (0.37%) Web Services
17 22 (0.36%) Middleware
Miscellaneous
1 446 (7.26%) Management Information System
2 416 (6.78%) Driving Licence
3 252 (4.10%) Self-Motivation
4 141 (2.30%) Onboarding
5 101 (1.64%) Product Ownership
6 97 (1.58%) FMCG
7 77 (1.25%) PMI
8 73 (1.19%) Credit Risk
9 72 (1.17%) Data Centre
10 67 (1.09%) Social Media
11 63 (1.03%) Analytical Mindset
12 59 (0.96%) Renewable Energy
13 54 (0.88%) Enterprise Software
14 52 (0.85%) Legacy Systems
15 51 (0.83%) Virtual Team
16 50 (0.81%) Life Science
17 43 (0.70%) Mobile App
18 41 (0.67%) IoT
19 37 (0.60%) NHS
20 35 (0.57%) Robotics
Operating Systems
1 311 (5.07%) Windows
2 146 (2.38%) Linux
3 136 (2.21%) Windows Server
4 29 (0.47%) Unix
5 28 (0.46%) CentOS
5 28 (0.46%) Windows Vista
6 25 (0.41%) Windows 10
7 20 (0.33%) Android
8 18 (0.29%) Apple iOS
8 18 (0.29%) Windows Server 2016
9 16 (0.26%) Ubuntu
10 15 (0.24%) Windows Server 2019
11 12 (0.20%) Mac OS
12 7 (0.11%) Red Hat Enterprise Linux
13 6 (0.098%) Mac OS X
14 5 (0.081%) VMS
15 3 (0.049%) Solaris
15 3 (0.049%) Windows 7
15 3 (0.049%) Windows Server 2012
16 2 (0.033%) Oracle Linux
Processes & Methodologies
1 1,274 (20.75%) Problem-Solving
2 1,210 (19.71%) Agile
3 1,195 (19.46%) Project Delivery
4 922 (15.02%) Stakeholder Management
5 843 (13.73%) Risk Management
6 816 (13.29%) PRINCE2
7 701 (11.42%) Continuous Improvement
8 491 (8.00%) Mentoring
9 472 (7.69%) Change Management
10 458 (7.46%) Coaching
11 410 (6.68%) Roadmaps
12 399 (6.50%) Decision-Making
13 368 (5.99%) Budget Management
14 354 (5.77%) Business Case
15 351 (5.72%) ERP
16 347 (5.65%) Cybersecurity
17 345 (5.62%) ITIL
18 339 (5.52%) Collaborative Working
19 334 (5.44%) Budgeting
20 329 (5.36%) Computer Science
Programming Languages
1 411 (6.69%) SQL
2 265 (4.32%) Python
3 145 (2.36%) JavaScript
4 136 (2.21%) C#
5 124 (2.02%) Java
6 103 (1.68%) PowerShell
7 91 (1.48%) PHP
8 85 (1.38%) C
9 78 (1.27%) C++
10 45 (0.73%) T-SQL
11 38 (0.62%) Bash
12 35 (0.57%) TypeScript
13 34 (0.55%) MATLAB
14 31 (0.50%) R
15 28 (0.46%) VBA
16 27 (0.44%) Objective-C
17 23 (0.37%) Kotlin
17 23 (0.37%) Scala
18 19 (0.31%) VB
19 18 (0.29%) Data Analysis Expressions
Qualifications
1 1,944 (31.66%) Degree
2 296 (4.82%) PMP
3 270 (4.40%) PMI Certification
4 244 (3.97%) Security Cleared
5 240 (3.91%) HNC
6 237 (3.86%) BPSS Clearance
7 167 (2.72%) Master's Degree
8 166 (2.70%) Computer Science Degree
9 134 (2.18%) SC Cleared
10 112 (1.82%) CISSP
11 108 (1.76%) DBS Check
12 94 (1.53%) PRINCE2 Certification
13 92 (1.50%) ACCA
13 92 (1.50%) CISM
14 74 (1.21%) MBA
15 72 (1.17%) Microsoft Certification
16 68 (1.11%) CESG Certified Professional
17 55 (0.90%) Cisco Certification
18 47 (0.77%) HND
18 47 (0.77%) MRICS
Quality Assurance & Compliance
1 455 (7.41%) QA
2 309 (5.03%) PMO
3 293 (4.77%) NEBOSH
4 161 (2.62%) ISO/IEC 27001
5 136 (2.21%) IFRS
6 100 (1.63%) NIST
7 93 (1.51%) Accessibility
8 87 (1.42%) Data Quality
9 85 (1.38%) GDPR
10 82 (1.34%) GAAP
11 81 (1.32%) SLA
12 68 (1.11%) JSP 440
12 68 (1.11%) RMADS
13 41 (0.67%) IFRS 9
14 29 (0.47%) GMP
14 29 (0.47%) Sarbanes-Oxley
15 28 (0.46%) Cyber Essentials
16 26 (0.42%) ISO 9001
17 24 (0.39%) P3O
18 23 (0.37%) Good Clinical Practice
System Software
1 170 (2.77%) Active Directory
2 78 (1.27%) VMware Infrastructure
3 60 (0.98%) Hyper-V
4 45 (0.73%) Docker
5 23 (0.37%) Virtual Machines
6 17 (0.28%) vSphere
7 16 (0.26%) Firmware
8 15 (0.24%) pfSense
9 11 (0.18%) Virtual Desktop
10 7 (0.11%) Embedded Firmware
11 5 (0.081%) VMware ESXi
11 5 (0.081%) XenDesktop
12 3 (0.049%) DFS Replication
12 3 (0.049%) Microsoft App-V
12 3 (0.049%) Terminal Server
13 2 (0.033%) KVM
13 2 (0.033%) Postfix
13 2 (0.033%) Sendmail
13 2 (0.033%) Virtual Servers
14 1 (0.016%) Slurm Workload Manager
Systems Management
1 92 (1.50%) Terraform
2 70 (1.14%) Microsoft Intune
3 62 (1.01%) Kubernetes
4 42 (0.68%) Ansible
5 29 (0.47%) Single Sign-On
6 22 (0.36%) SCCM
7 13 (0.21%) Autotask
8 9 (0.15%) Puppet
9 8 (0.13%) Grafana
10 7 (0.11%) EMC NetWorker
11 6 (0.098%) Argo
12 5 (0.081%) FortiGate
12 5 (0.081%) Nagios
12 5 (0.081%) WSUS
12 5 (0.081%) ZABBIX
13 4 (0.065%) Active Directory Federation Services
13 4 (0.065%) BMC PATROL
13 4 (0.065%) vCenter Server
14 3 (0.049%) PaperCut
15 2 (0.033%) AirWatch
Vendors
1 1,022 (16.64%) Microsoft
2 240 (3.91%) NEC
3 223 (3.63%) SAP
4 125 (2.04%) Oracle
5 112 (1.82%) Google
6 95 (1.55%) VMware
7 91 (1.48%) Cisco
8 76 (1.24%) Salesforce
9 51 (0.83%) Adobe
10 49 (0.80%) IBM
11 46 (0.75%) Meraki
12 44 (0.72%) ServiceNow
13 33 (0.54%) WooCommerce
14 31 (0.50%) Databricks
15 30 (0.49%) Atlassian
16 27 (0.44%) SolarWinds
16 27 (0.44%) Xamarin
17 26 (0.42%) Red Hat
18 25 (0.41%) Nimble Storage
19 23 (0.37%) Palo Alto