Enterprise Software Contracts with Work from Home Options

Enterprise Application Software
UK > Work from Home

The table below looks at the prevalence of the term Enterprise Software in remote or hybrid contract work. Included is a benchmarking guide to the contractor rates offered in vacancies that cited Enterprise Software over the 6 months leading up to 20 September 2024, comparing them to the same period in the previous two years.

6 months to
20 Sep 2024
Same period 2023 Same period 2022
Rank 222 302 316
Rank change year-on-year +80 +14 +14
Contract jobs citing Enterprise Software 110 120 325
As % of all contract jobs with a WFH option 0.87% 0.59% 0.78%
As % of the Miscellaneous category 2.86% 1.90% 2.47%
Number of daily rates quoted 66 78 235
10th Percentile £438 £375 £413
25th Percentile £478 £453 £470
Median daily rate (50th Percentile) £563 £545 £550
Median % change year-on-year +3.21% -0.91% +5.57%
75th Percentile £672 £700 £709
90th Percentile £1,000 £738 £775
UK median daily rate £525 £575 £575
% change year-on-year -8.70% - +6.48%
Number of hourly rates quoted 0 1 0
Median hourly rate - £27.50 -
UK median hourly rate - £63.50 -

All Generic Skills
Work from Home

Enterprise Software falls under the General and Transferable Skills category. For comparison with the information above, the following table provides summary statistics for all contract job vacancies with remote or hybrid options requiring generic IT skills.

Contract vacancies with a requirement for generic IT skills 3,850 6,300 13,139
As % of all contract jobs with a WFH option 30.40% 31.01% 31.72%
Number of daily rates quoted 2,510 4,507 9,456
10th Percentile £325 £350 £373
25th Percentile £438 £450 £460
Median daily rate (50th Percentile) £550 £550 £550
Median % change year-on-year - - +10.00%
75th Percentile £688 £675 £675
90th Percentile £850 £775 £775
UK median daily rate £540 £550 £550
% change year-on-year -1.82% - +4.76%
Number of hourly rates quoted 90 141 172
10th Percentile £20.18 £19.99 £16.00
25th Percentile £31.26 £25.71 £23.19
Median hourly rate £64.25 £52.50 £54.00
Median % change year-on-year +22.38% -2.78% +54.29%
75th Percentile £72.50 £70.00 £70.00
90th Percentile £85.00 £75.00 £78.75
UK median hourly rate £50.00 £44.50 £26.50
% change year-on-year +12.36% +67.92% +6.00%

Enterprise Software
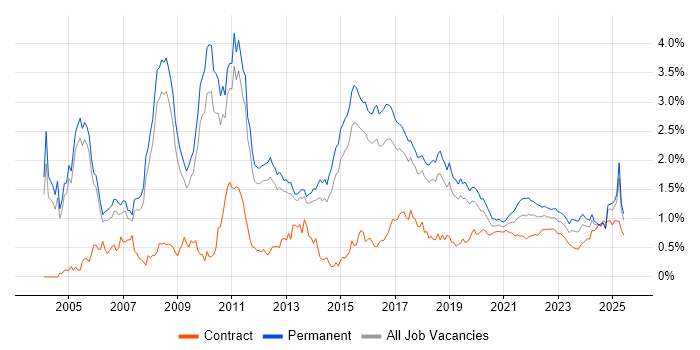
Trend for Jobs with a WFH Option

Job vacancies with a work from home option citing Enterprise Software as a proportion of all IT jobs advertised.

Enterprise Software trend for jobs with a WFH option

Enterprise Software
Daily Rate Trend for Jobs with a WFH Option

3-month moving average daily rate quoted in job vacancies with a work from home option citing Enterprise Software.

Enterprise Software daily rate for jobs with a WFH option

Enterprise Software
Daily Rate Histogram for Jobs with a WFH Option

Daily rate distribution for jobs with a work from home option citing Enterprise Software over the 6 months to 20 September 2024.

Enterprise Software daily rate histogram for jobs with a WFH option

Enterprise Software
Hourly Rate Trend for Jobs with a WFH Option

3-month moving average hourly rate quoted in job vacancies with a work from home option citing Enterprise Software.

Enterprise Software hourly rate for jobs with a WFH option

Enterprise Software
Co-occurring Skills and Capabilities with WFH Options by Category

The follow tables expand on the table above by listing co-occurrences grouped by category. The same employment type, locality and period is covered with up to 20 co-occurrences shown in each of the following categories:

Application Platforms
1 7 (6.36%) CMS
2 6 (5.45%) Cloud Foundry
3 3 (2.73%) Confluence
3 3 (2.73%) SharePoint
4 2 (1.82%) JBoss
4 2 (1.82%) Microsoft Exchange
4 2 (1.82%) Oracle SOA Suite
5 1 (0.91%) Drupal
5 1 (0.91%) Exchange Server 2013
5 1 (0.91%) Joomla!
5 1 (0.91%) Kentico
5 1 (0.91%) Orchard CMS
5 1 (0.91%) Red Hat Fuse
5 1 (0.91%) Umbraco
5 1 (0.91%) WebLogic
5 1 (0.91%) WebSphere
Applications
1 1 (0.91%) Microsoft Excel
1 1 (0.91%) MS Visio
Business Applications
1 4 (3.64%) Oracle EBS
1 4 (3.64%) Oracle ERP
1 4 (3.64%) PeopleSoft HCM
2 1 (0.91%) BusinessWorks
2 1 (0.91%) Relativity
2 1 (0.91%) Temenos T24
2 1 (0.91%) Unit4 Business World
2 1 (0.91%) Veritas eDiscovery
Cloud Services
1 41 (37.27%) Azure
2 37 (33.64%) AWS
3 15 (13.64%) SaaS
4 8 (7.27%) GCP
5 7 (6.36%) Serverless
6 5 (4.55%) OpenShift
6 5 (4.55%) PaaS
7 4 (3.64%) Amazon ECS
7 4 (3.64%) AWS CodeBuild
7 4 (3.64%) AWS CodeDeploy
7 4 (3.64%) AWS CodePipeline
7 4 (3.64%) AWS Fargate
7 4 (3.64%) AWS Lambda
7 4 (3.64%) Kong
7 4 (3.64%) Microsoft 365
7 4 (3.64%) OCI
8 3 (2.73%) Amazon GuardDuty
8 3 (2.73%) Amazon OpenSearch
8 3 (2.73%) Azure DevOps
8 3 (2.73%) Route 53
Communications & Networking
1 4 (3.64%) Firewall
2 3 (2.73%) IPv6
3 1 (0.91%) BGP
3 1 (0.91%) Cisco IOS
3 1 (0.91%) Cisco Nexus
3 1 (0.91%) DNS
3 1 (0.91%) FTP
3 1 (0.91%) IOS XR
3 1 (0.91%) LAN
3 1 (0.91%) MPLS
3 1 (0.91%) Reverse Proxy
3 1 (0.91%) VPN
3 1 (0.91%) WAN
3 1 (0.91%) WinSCP
3 1 (0.91%) WLAN
Database & Business Intelligence
1 17 (15.45%) SQL Server
2 16 (14.55%) Elasticsearch
3 15 (13.64%) Data Warehouse
4 14 (12.73%) Amazon RDS
4 14 (12.73%) Couchbase
4 14 (12.73%) NoSQL
4 14 (12.73%) OLTP
5 13 (11.82%) Amazon Aurora
5 13 (11.82%) Oracle Database
6 7 (6.36%) DB2
7 5 (4.55%) PostgreSQL
8 4 (3.64%) MongoDB
9 3 (2.73%) InfluxDB
9 3 (2.73%) Relational Database
10 1 (0.91%) Apache Cassandra
10 1 (0.91%) Azure SQL Database
10 1 (0.91%) Big Data
10 1 (0.91%) DynamoDB
10 1 (0.91%) MariaDB
10 1 (0.91%) Tableau
Development Applications
1 13 (11.82%) Git
2 10 (9.09%) Maven
3 9 (8.18%) git-flow
4 5 (4.55%) Jenkins
4 5 (4.55%) JIRA
5 4 (3.64%) Artifactory
5 4 (3.64%) GitLab
6 2 (1.82%) Cucumber
6 2 (1.82%) Selenium
7 1 (0.91%) Bitbucket
7 1 (0.91%) FitNesse
7 1 (0.91%) MSI
7 1 (0.91%) Oracle APEX
7 1 (0.91%) Postman
7 1 (0.91%) Sonatype Nexus
7 1 (0.91%) SpecFlow
7 1 (0.91%) Visual Studio
7 1 (0.91%) Visual Studio Coded UI
General
1 25 (22.73%) Finance
2 21 (19.09%) Banking
3 16 (14.55%) Social Skills
4 11 (10.00%) Marketing
5 10 (9.09%) Legal
6 8 (7.27%) Public Sector
7 6 (5.45%) Influencing Skills
8 4 (3.64%) Inclusion and Diversity
8 4 (3.64%) Pharmaceutical
9 3 (2.73%) Presentation Skills
10 2 (1.82%) Analytical Skills
10 2 (1.82%) Investment Banking
10 2 (1.82%) Organisational Skills
10 2 (1.82%) Retail
11 1 (0.91%) Arabic Language
11 1 (0.91%) French Language
11 1 (0.91%) German Language
11 1 (0.91%) Japanese Language
11 1 (0.91%) Korean Language
11 1 (0.91%) Local Government
Job Titles
1 25 (22.73%) Developer
2 24 (21.82%) DBA
3 23 (20.91%) Architect
4 19 (17.27%) Consultant
5 18 (16.36%) Senior
6 16 (14.55%) Solutions Architect
7 10 (9.09%) Java Developer
7 10 (9.09%) Oracle DBA
7 10 (9.09%) Oracle Developer
7 10 (9.09%) SQL DBA
7 10 (9.09%) SQL Developer
8 9 (8.18%) JavaScript Engineer
8 9 (8.18%) UI Engineer
9 8 (7.27%) Full-Stack Developer
10 6 (5.45%) Cloud Consultant
10 6 (5.45%) Database Consultant
11 5 (4.55%) Senior Consultant
11 5 (4.55%) Technical Architect
12 4 (3.64%) Functional Consultant
12 4 (3.64%) Network Engineer
Libraries, Frameworks & Software Standards
1 18 (16.36%) .NET
2 14 (12.73%) Kafka
2 14 (12.73%) React
3 12 (10.91%) CSS
4 10 (9.09%) Hibernate
4 10 (9.09%) JPA
5 9 (8.18%) Jest
5 9 (8.18%) LESS
5 9 (8.18%) Material-UI
5 9 (8.18%) OpenFin
5 9 (8.18%) Redux
5 9 (8.18%) Sass
5 9 (8.18%) Tailwind CSS
5 9 (8.18%) WebSockets
6 7 (6.36%) REST
6 7 (6.36%) Svelte
7 5 (4.55%) Oracle Fusion
8 4 (3.64%) AWS CDK
8 4 (3.64%) Spring
8 4 (3.64%) Spring Boot
Miscellaneous
1 14 (12.73%) Replication
2 13 (11.82%) Management Information System
3 9 (8.18%) Fixed Income
3 9 (8.18%) iPad
4 5 (4.55%) Cloud Native
4 5 (4.55%) Mainframe
4 5 (4.55%) Public Cloud
5 3 (2.73%) Algorithms
5 3 (2.73%) Data Structures
6 2 (1.82%) Derivative
6 2 (1.82%) SWIFT Messaging Network
7 1 (0.91%) Blog
7 1 (0.91%) Cyber Threat
7 1 (0.91%) Data Centre
7 1 (0.91%) DataPower
7 1 (0.91%) Enterprise Cloud
7 1 (0.91%) FMCG
7 1 (0.91%) IoT
7 1 (0.91%) Linux Command Line
7 1 (0.91%) Self-Motivation
Operating Systems
1 8 (7.27%) Windows
2 7 (6.36%) Linux
3 5 (4.55%) Android
3 5 (4.55%) Apple iOS
4 4 (3.64%) Red Hat Enterprise Linux
5 3 (2.73%) Ubuntu
5 3 (2.73%) Windows Server
6 2 (1.82%) Windows Server 2012
6 2 (1.82%) Windows Server 2019
7 1 (0.91%) Unix
7 1 (0.91%) Windows 10
7 1 (0.91%) Windows Server 2016
7 1 (0.91%) Windows XP
Processes & Methodologies
1 29 (26.36%) Software Engineering
2 28 (25.45%) Agile
3 27 (24.55%) SDLC
4 21 (19.09%) Containerisation
5 18 (16.36%) Roadmaps
6 17 (15.45%) Microservices
7 14 (12.73%) E-Commerce
7 14 (12.73%) ERP
7 14 (12.73%) Performance Tuning
7 14 (12.73%) User Experience
8 13 (11.82%) Analytics
8 13 (11.82%) DevOps
9 12 (10.91%) Problem-Solving
10 11 (10.00%) CI/CD
10 11 (10.00%) Information Security
10 11 (10.00%) Kanban
11 10 (9.09%) Customer Experience
11 10 (9.09%) Database Tuning
11 10 (9.09%) Project Management
11 10 (9.09%) Scrum
Programming Languages
1 51 (46.36%) Java
2 47 (42.73%) SQL
3 15 (13.64%) JavaScript
4 13 (11.82%) Python
4 13 (11.82%) Scala
5 12 (10.91%) C#
5 12 (10.91%) TypeScript
6 6 (5.45%) Bash
7 5 (4.55%) Go
8 4 (3.64%) C
8 4 (3.64%) Groovy
8 4 (3.64%) Ruby
9 3 (2.73%) PowerShell
10 2 (1.82%) Perl
11 1 (0.91%) ABAP
11 1 (0.91%) C++
11 1 (0.91%) PL/SQL
11 1 (0.91%) Shell Script
11 1 (0.91%) T-SQL
11 1 (0.91%) VB
Qualifications
1 5 (4.55%) Degree
1 5 (4.55%) Security Cleared
2 1 (0.91%) AWS Certification
2 1 (0.91%) Computer Science Degree
2 1 (0.91%) MCITP
2 1 (0.91%) MCSE
2 1 (0.91%) Microsoft Certification
2 1 (0.91%) OCP
2 1 (0.91%) Oracle Certification
2 1 (0.91%) SC Cleared
Quality Assurance & Compliance
1 3 (2.73%) GDPR
1 3 (2.73%) QA
2 1 (0.91%) Data Quality
2 1 (0.91%) Disclosure Scotland
System Software
1 27 (24.55%) Docker
2 13 (11.82%) VMware Infrastructure
3 2 (1.82%) Active Directory
3 2 (1.82%) Hyper-V
4 1 (0.91%) Citrix Presentation Server
4 1 (0.91%) Virtual Machines
Systems Management
1 32 (29.09%) Kubernetes
2 7 (6.36%) Ansible
3 6 (5.45%) Terraform
4 3 (2.73%) Grafana
4 3 (2.73%) Kibana
4 3 (2.73%) SCCM
5 2 (1.82%) Opsgenie
5 2 (1.82%) Single Sign-On
6 1 (0.91%) Backup Exec
6 1 (0.91%) FortiGate
6 1 (0.91%) HP SIM
6 1 (0.91%) Microsoft Intune
6 1 (0.91%) Prometheus
6 1 (0.91%) Red Hat Satellite
6 1 (0.91%) SCDPM
6 1 (0.91%) SCVMM
6 1 (0.91%) Symantec Endpoint Protection
6 1 (0.91%) TIBCO Hawk
6 1 (0.91%) WSUS
Vendors
1 28 (25.45%) Oracle
2 15 (13.64%) Microsoft
3 13 (11.82%) VMware
4 7 (6.36%) Databricks
5 4 (3.64%) Dynatrace
5 4 (3.64%) Hyperion
5 4 (3.64%) JD Edwards
5 4 (3.64%) PeopleSoft
6 3 (2.73%) IBM
6 3 (2.73%) MuleSoft
7 2 (1.82%) Cisco
7 2 (1.82%) Citrix
7 2 (1.82%) Imperva
7 2 (1.82%) PagerDuty
7 2 (1.82%) Red Hat
7 2 (1.82%) Splunk
8 1 (0.91%) Civica
8 1 (0.91%) EnterpriseDB
8 1 (0.91%) Google
8 1 (0.91%) Veeam