Master's Degree Contracts in London

Master's Degree
England > London

The table below provides summary statistics for contract job vacancies advertised in London with a requirement for Master's Degree qualifications. It includes a benchmarking guide to the contractor rates offered over the 6 months leading up to 10 November 2024, comparing them to the same period in the previous two years.

6 months to
10 Nov 2024
Same period 2023 Same period 2022
Rank 191 236 294
Rank change year-on-year +45 +58 +45
Contract jobs citing Master's Degree 197 201 321
As % of all contract jobs advertised in London 1.28% 0.99% 0.87%
As % of the Qualifications category 5.03% 4.27% 4.70%
Number of daily rates quoted 119 145 201
10th Percentile £369 £365 £450
25th Percentile £474 £540 £575
Median daily rate (50th Percentile) £575 £700 £700
Median % change year-on-year -17.86% - -
75th Percentile £750 £874 £850
90th Percentile £890 £1,000 £938
England median daily rate £550 £650 £625
% change year-on-year -15.38% +4.00% +8.70%
Number of hourly rates quoted 2 3 13
10th Percentile £48.43 £57.50 £27.85
25th Percentile £51.69 £59.38 £39.25
Median hourly rate £57.75 £65.00 £50.50
Median % change year-on-year -11.15% +28.71% -13.68%
75th Percentile £63.19 £66.25 £53.75
90th Percentile £66.08 £67.00 £77.70
England median hourly rate £27.67 £57.50 £45.00
% change year-on-year -51.88% +27.78% -5.35%

All Academic and Professional Certifications
London

Master's Degree falls under the Academic Qualifications and Professional Certifications category. For comparison with the information above, the following table provides summary statistics for all contract job vacancies requiring academic qualifications or professional certifications in London.

Contract vacancies requiring academic qualifications or professional certifications 3,916 4,705 6,830
As % of all contract IT jobs advertised in London 25.40% 23.16% 18.47%
Number of daily rates quoted 2,496 3,200 4,644
10th Percentile £350 £350 £378
25th Percentile £450 £453 £475
Median daily rate (50th Percentile) £544 £550 £575
Median % change year-on-year -1.14% -4.35% +4.55%
75th Percentile £650 £675 £680
90th Percentile £763 £775 £780
England median daily rate £528 £550 £550
% change year-on-year -4.09% - +7.84%
Number of hourly rates quoted 53 103 78
10th Percentile £20.10 £19.00 £18.78
25th Percentile £31.62 £23.63 £28.81
Median hourly rate £41.91 £54.00 £45.75
Median % change year-on-year -22.39% +18.03% +21.51%
75th Percentile £63.75 £69.00 £60.56
90th Percentile £77.97 £86.50 £77.25
England median hourly rate £50.00 £52.50 £45.00
% change year-on-year -4.76% +16.67% +59.29%

Master's Degree
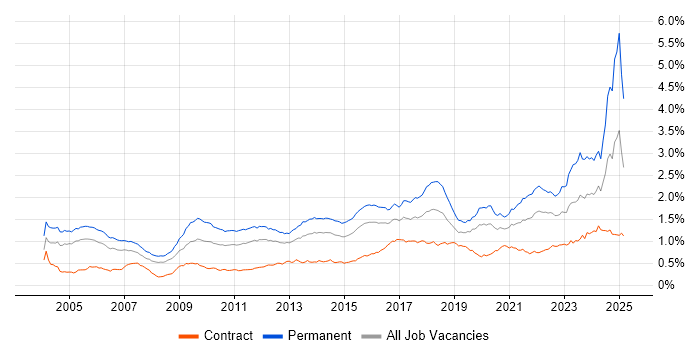
Job Vacancy Trend in London

Job postings citing Master's Degree as a proportion of all IT jobs advertised in London.

Job vacancy trend for Master's Degree in London

Master's Degree
Contractor Daily Rate Trend in London

3-month moving average daily rate quoted in jobs citing Master's Degree in London.

Daily rate trend for Master's Degree in London

Master's Degree
Daily Rate Histogram in London

Daily rate distribution for jobs citing Master's Degree in London over the 6 months to 10 November 2024.

Daily rate histogram for Master's Degree in London

Master's Degree
Contractor Hourly Rate Trend in London

3-month moving average hourly rates quoted in jobs citing Master's Degree in London.

Hourly rate trend for Master's Degree in London

Master's Degree
Hourly Rate Histogram in London

Hourly rate distribution of jobs citing Master's Degree in London over the 6 months to 10 November 2024.

Hourly rate histogram for Master's Degree in London

Master's Degree
Contract Job Locations in London

The table below looks at the demand and provides a guide to the median contractor rates quoted in IT jobs citing Master's Degree within the London region over the 6 months to 10 November 2024. The 'Rank Change' column provides an indication of the change in demand within each location based on the same 6 month period last year.

Location Rank Change
on Same Period
Last Year
Matching
Contract
IT Job Ads
Median
Daily Rate
Past 6 Months
Median Daily Rate
% Change
on Same Period
Last Year
Live
Jobs
Central London +24 26 £510 -35.24% 27
South London +6 4 - - 5
West London +18 3 £208 +383.72% 7
East London +11 1 £472 -32.57% 11
Master's Degree
England

Master's Degree
Co-occurring Skills and Capabilities in London by Category

The follow tables expand on the table above by listing co-occurrences grouped by category. The same employment type, locality and period is covered with up to 20 co-occurrences shown in each of the following categories:

Application Platforms
1 15 (7.61%) Apache Spark
2 3 (1.52%) Apache
3 2 (1.02%) Apache Airflow
3 2 (1.02%) ArcGIS
3 2 (1.02%) Oracle Spatial
4 1 (0.51%) GeoServer
4 1 (0.51%) Jupyter
Applications
1 3 (1.52%) Microsoft Excel
1 3 (1.52%) Microsoft Office
2 2 (1.02%) SPSS
2 2 (1.02%) UserZoom
3 1 (0.51%) Chatbot
3 1 (0.51%) Microsoft PowerPoint
3 1 (0.51%) Revit
3 1 (0.51%) Spreadsheet
Business Applications
1 6 (3.05%) SAP S/4HANA
2 4 (2.03%) Misys Opics
3 3 (1.52%) SAP CRM
3 3 (1.52%) SAP SRM
4 2 (1.02%) Endur
4 2 (1.02%) Oracle Assets
4 2 (1.02%) Oracle Cash Management
4 2 (1.02%) Oracle EBS
4 2 (1.02%) Oracle Financials
4 2 (1.02%) Oracle General Ledger
4 2 (1.02%) Oracle Payables
4 2 (1.02%) Oracle Receivables
5 1 (0.51%) Dynamics CRM
5 1 (0.51%) SAP MDG
5 1 (0.51%) SAP MDG-S
5 1 (0.51%) SAP MDM
5 1 (0.51%) Sprinklr
Cloud Services
1 49 (24.87%) Azure
2 36 (18.27%) AWS
3 31 (15.74%) GCP
4 10 (5.08%) Power Platform
5 7 (3.55%) Azure App Service
5 7 (3.55%) Azure Service Bus
5 7 (3.55%) GitHub
6 6 (3.05%) Azure Data Factory
6 6 (3.05%) Azure Event Grid
7 5 (2.54%) Azure AKS
7 5 (2.54%) Azure DevOps
8 4 (2.03%) Azure Logic Apps
8 4 (2.03%) Cloud Computing
8 4 (2.03%) Microsoft 365
9 3 (1.52%) OpenShift
9 3 (1.52%) Serverless
9 3 (1.52%) Snowflake
9 3 (1.52%) Vertex AI
10 2 (1.02%) Azure Cosmos DB
10 2 (1.02%) SurveyMonkey
Communications & Networking
1 15 (7.61%) CTI
1 15 (7.61%) VoIP
2 6 (3.05%) Firewall
3 4 (2.03%) Cisco IOS
3 4 (2.03%) DNS
3 4 (2.03%) IOS XR
3 4 (2.03%) NX-OS
4 2 (1.02%) LAN
4 2 (1.02%) NAS
4 2 (1.02%) Network Security
4 2 (1.02%) SAN
4 2 (1.02%) SD-WAN
4 2 (1.02%) VPN
4 2 (1.02%) WAN
5 1 (0.51%) HTTP
5 1 (0.51%) Internet
5 1 (0.51%) Intrusion Detection
5 1 (0.51%) SSL
5 1 (0.51%) TCP/IP
Database & Business Intelligence
1 13 (6.60%) NoSQL
2 12 (6.09%) Data Warehouse
3 10 (5.08%) Big Data
3 10 (5.08%) Power BI
3 10 (5.08%) SQL Server
4 9 (4.57%) Tableau
5 8 (4.06%) Data Mining
6 6 (3.05%) Data Lake
6 6 (3.05%) Hadoop
7 5 (2.54%) Azure SQL Database
8 4 (2.03%) BigQuery
8 4 (2.03%) PostgreSQL
9 3 (1.52%) Elasticsearch
9 3 (1.52%) SAP BW
10 2 (1.02%) Bigtable
10 2 (1.02%) GIS
10 2 (1.02%) KDB
10 2 (1.02%) MongoDB
10 2 (1.02%) NonStop SQL
10 2 (1.02%) SQL Server Integration Services
Development Applications
1 14 (7.11%) Jenkins
2 7 (3.55%) Git
3 6 (3.05%) Atlassian Bamboo
3 6 (3.05%) fastlane
4 4 (2.03%) JIRA
5 3 (1.52%) Bitbucket
5 3 (1.52%) MLflow
5 3 (1.52%) TeamCity
6 2 (1.02%) Artifactory
6 2 (1.02%) Storybook
7 1 (0.51%) Appium
7 1 (0.51%) GitLab
7 1 (0.51%) IBM UrbanCode
7 1 (0.51%) Katalon Studio
7 1 (0.51%) MSI
7 1 (0.51%) Travis CI
7 1 (0.51%) Visual Studio
7 1 (0.51%) Visual Studio Code
General
1 89 (45.18%) Social Skills
2 82 (41.62%) Analytical Skills
3 49 (24.87%) Finance
4 33 (16.75%) Banking
5 14 (7.11%) Marketing
6 13 (6.60%) Front Office
7 11 (5.58%) Public Sector
8 7 (3.55%) Investment Banking
8 7 (3.55%) Pharmaceutical
9 5 (2.54%) Legal
9 5 (2.54%) Manufacturing
9 5 (2.54%) Telecoms
10 4 (2.03%) Financial Institution
11 3 (1.52%) Automotive
11 3 (1.52%) Inclusion and Diversity
11 3 (1.52%) Influencing Skills
11 3 (1.52%) Presentation Skills
11 3 (1.52%) Retail
12 2 (1.02%) Documentation Skills
12 2 (1.02%) Organisational Skills
Job Titles
1 35 (17.77%) Architect
2 29 (14.72%) Lead
3 25 (12.69%) Developer
4 12 (6.09%) Java Developer
4 12 (6.09%) Senior
5 10 (5.08%) Solutions Architect
6 9 (4.57%) Analyst
6 9 (4.57%) Consultant
6 9 (4.57%) Machine Learning Engineer
7 8 (4.06%) Data Scientist
8 7 (3.55%) Lead Data Scientist
8 7 (3.55%) Senior Data Scientist
9 6 (3.05%) Integration Architect
9 6 (3.05%) Project Manager
10 5 (2.54%) Business Analyst
10 5 (2.54%) Data Engineer
10 5 (2.54%) Java Engineer
10 5 (2.54%) Senior Developer
10 5 (2.54%) Software Engineer
11 4 (2.03%) AWS Engineer
Libraries, Frameworks & Software Standards
1 13 (6.60%) CSS
1 13 (6.60%) HTML
1 13 (6.60%) React
1 13 (6.60%) Spring
2 12 (6.09%) Kafka
2 12 (6.09%) Spring Boot
3 10 (5.08%) AngularJS
3 10 (5.08%) Middleware
4 8 (4.06%) GraphQL
4 8 (4.06%) Spring MVC
5 7 (3.55%) .NET
6 6 (3.05%) RESTful
6 6 (3.05%) Spring Security
7 5 (2.54%) PySpark
7 5 (2.54%) TensorFlow
8 4 (2.03%) Pandas
8 4 (2.03%) PyTorch
9 3 (1.52%) NumPy
9 3 (1.52%) REST
9 3 (1.52%) SOAP
Miscellaneous
1 18 (9.14%) Management Information System
2 15 (7.61%) IVR
3 8 (4.06%) Data Protection Act
4 7 (3.55%) Tandem
5 6 (3.05%) Algorithms
5 6 (3.05%) Distributed Computing
6 5 (2.54%) Analytical Mindset
6 5 (2.54%) Data Centre
6 5 (2.54%) Distributed Systems
6 5 (2.54%) FMCG
7 4 (2.03%) Fixed Income
7 4 (2.03%) Market Risk
7 4 (2.03%) Self-Motivation
8 3 (1.52%) Mobile App
8 3 (1.52%) Social Media
8 3 (1.52%) Team-Oriented Environment
8 3 (1.52%) Virtual Team
9 2 (1.02%) Credit Risk
9 2 (1.02%) Enterprise Software
9 2 (1.02%) Public Cloud
Operating Systems
1 5 (2.54%) Unix
2 3 (1.52%) Apple iOS
3 2 (1.02%) Android
3 2 (1.02%) Linux
3 2 (1.02%) Windows
4 1 (0.51%) Windows Server
Processes & Methodologies
1 139 (70.56%) Computer Science
2 87 (44.16%) Problem-Solving
3 46 (23.35%) Data Science
4 43 (21.83%) Machine Learning
5 39 (19.80%) Artificial Intelligence
6 38 (19.29%) Agile
7 36 (18.27%) Roadmaps
8 35 (17.77%) Analytics
9 33 (16.75%) CI/CD
10 30 (15.23%) Mentoring
11 28 (14.21%) Stakeholder Management
12 26 (13.20%) Project Management
13 25 (12.69%) Data Modelling
14 24 (12.18%) DevOps
14 24 (12.18%) Technical Leadership
15 21 (10.66%) Data Pipeline
16 20 (10.15%) Software Engineering
17 19 (9.64%) Data Management
17 19 (9.64%) Decision-Making
18 18 (9.14%) Value Proposition
Programming Languages
1 72 (36.55%) Python
2 44 (22.34%) Java
3 37 (18.78%) SQL
4 20 (10.15%) C++
5 16 (8.12%) C#
5 16 (8.12%) Shell Script
6 14 (7.11%) JavaScript
7 10 (5.08%) C
8 5 (2.54%) R
9 4 (2.03%) Kotlin
10 3 (1.52%) Go
10 3 (1.52%) Scala
11 2 (1.02%) Bash
11 2 (1.02%) MATLAB
11 2 (1.02%) Swift
11 2 (1.02%) TypeScript
12 1 (0.51%) ABAP
12 1 (0.51%) PHP
12 1 (0.51%) T-SQL
12 1 (0.51%) VBA
Qualifications
1 197 (100.00%) Degree
2 97 (49.24%) Computer Science Degree
3 30 (15.23%) PhD
4 12 (6.09%) MBA
4 12 (6.09%) Security Cleared
5 9 (4.57%) PMI Certification
6 8 (4.06%) CISSP
6 8 (4.06%) PMP
7 7 (3.55%) CISM
7 7 (3.55%) Numerate Degree
7 7 (3.55%) SC Cleared
8 4 (2.03%) Azure Certification
8 4 (2.03%) CCIE
8 4 (2.03%) CCNP
8 4 (2.03%) CEH
8 4 (2.03%) Cisco Certification
9 3 (1.52%) CGEIT
9 3 (1.52%) CISA
9 3 (1.52%) Microsoft Certification
9 3 (1.52%) SAP Certification
Quality Assurance & Compliance
1 12 (6.09%) Data Quality
2 6 (3.05%) GDPR
3 4 (2.03%) COBIT
3 4 (2.03%) QA
4 3 (1.52%) GRC
4 3 (1.52%) ISO/IEC 27001
5 2 (1.02%) Accessibility
5 2 (1.02%) Actionable Recommendations
5 2 (1.02%) Basel III
5 2 (1.02%) Cyber Essentials
5 2 (1.02%) NIST
5 2 (1.02%) NIST 800
6 1 (0.51%) California Consumer Privacy Act
6 1 (0.51%) SNOMED CT
System Software
1 11 (5.58%) Docker
2 4 (2.03%) Active Directory
3 2 (1.02%) VMware Infrastructure
4 1 (0.51%) Lustre
4 1 (0.51%) Virtual Desktop
Systems Management
1 16 (8.12%) Kubernetes
2 10 (5.08%) Terraform
3 5 (2.54%) Ansible
4 2 (1.02%) Grafana
4 2 (1.02%) Microsoft Intune
4 2 (1.02%) Podman
5 1 (0.51%) Karpenter
Vendors
1 16 (8.12%) Microsoft
2 15 (7.61%) Genesys
3 14 (7.11%) Google
4 9 (4.57%) Databricks
4 9 (4.57%) Salesforce
5 6 (3.05%) SAP
6 5 (2.54%) Oracle
7 4 (2.03%) Cisco
7 4 (2.03%) F5
7 4 (2.03%) Fortinet
7 4 (2.03%) ION Trading
7 4 (2.03%) Nokia
7 4 (2.03%) VMware
8 3 (1.52%) Foundry
8 3 (1.52%) Hyperion
8 3 (1.52%) IBM
8 3 (1.52%) Informatica
8 3 (1.52%) Palantir
8 3 (1.52%) Splunk
9 2 (1.02%) Adobe