Azure Job Trends in Reading

Microsoft Azure
Berkshire > Reading

The table below provides summary statistics and salary benchmarking for jobs advertised in Reading requiring Azure skills. It covers permanent job vacancies from the 6 months leading up to 22 November 2025, with comparisons to the same periods in the previous two years.

6 months to
22 Nov 2025
Same period 2024 Same period 2023
Rank 7 5 5
Rank change year-on-year -2 0 -1
Permanent jobs citing Azure 55 165 192
As % of all permanent jobs in Reading 10.81% 14.34% 19.09%
As % of the Cloud Services category 45.45% 48.10% 56.14%
Number of salaries quoted 38 100 146
10th Percentile £39,750 £36,250 £33,625
25th Percentile £47,500 £46,250 £36,000
Median annual salary (50th Percentile) £60,000 £59,125 £55,050
Median % change year-on-year +1.48% +7.40% -15.31%
75th Percentile £69,840 £75,000 £74,125
90th Percentile £78,500 £85,000 £79,625
Berkshire median annual salary £49,000 £62,500 £52,500
% change year-on-year -21.60% +19.05% -19.23%

All Cloud Skills
Reading

Azure falls under the Cloud Services category. For comparison with the information above, the following table provides summary statistics for all permanent job vacancies requiring cloud computing skills in Reading.

Permanent vacancies with a requirement for cloud computing skills 121 343 342
As % of all permanent jobs advertised in Reading 23.77% 29.80% 34.00%
Number of salaries quoted 69 172 232
10th Percentile £28,800 £35,000 £32,500
25th Percentile £42,500 £45,000 £37,275
Median annual salary (50th Percentile) £60,000 £60,000 £56,525
Median % change year-on-year - +6.15% -13.04%
75th Percentile £73,750 £77,500 £74,250
90th Percentile £91,250 £85,000 £83,750
Berkshire median annual salary £46,000 £60,000 £55,000
% change year-on-year -23.33% +9.09% -15.38%

Azure
Job Vacancy Trend in Reading

Historical trend showing the proportion of permanent IT job postings citing Azure relative to all permanent IT jobs advertised in Reading.
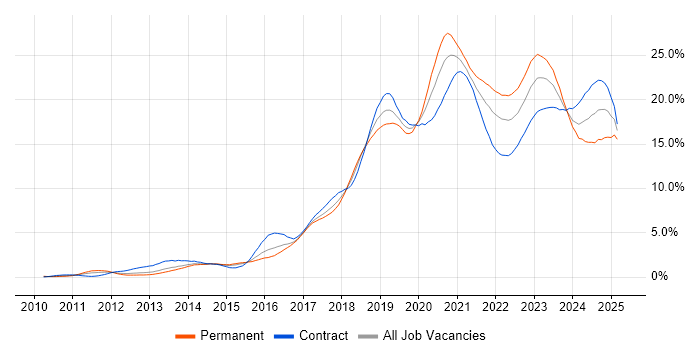
Azure job vacancy trend in Reading

Azure
Salary Trend in Reading

Salary distribution trend for jobs in Reading citing Azure.

Salary distribution trend for jobs in Reading citing Azure

Azure
Salary Histogram in Reading

Salary distribution for jobs citing Azure in Reading over the 6 months to 22 November 2025.

Salary histogram for Azure in Reading

Azure
Co-Occurring Skills & Capabilities in Reading by Category

The following tables expand on the one above by listing co-occurrences grouped by category. They cover the same employment type, locality and period, with up to 20 co-occurrences shown in each category:

Application Platforms
1 10 (18.18%) CMS
2 3 (5.45%) Microsoft Exchange
3 2 (3.64%) Confluence
3 2 (3.64%) IIS
4 1 (1.82%) SAS
4 1 (1.82%) SharePoint
Applications
1 1 (1.82%) Microsoft Excel
1 1 (1.82%) Spreadsheet
Cloud Services
1 16 (29.09%) Power Platform
2 15 (27.27%) AWS
3 9 (16.36%) Microsoft Purview
4 8 (14.55%) iPaaS
4 8 (14.55%) Microsoft 365
4 8 (14.55%) PaaS
5 7 (12.73%) SaaS
6 6 (10.91%) Azure DevOps
7 4 (7.27%) Azure Data Factory
7 4 (7.27%) GCP
8 3 (5.45%) Dynamics 365
9 2 (3.64%) Amazon CloudWatch
9 2 (3.64%) Amazon ELB
9 2 (3.64%) Amazon Glacier
9 2 (3.64%) AWS KMS
9 2 (3.64%) Azure Sentinel
9 2 (3.64%) Azure Synapse Analytics
9 2 (3.64%) Entra ID
9 2 (3.64%) Power Automate
9 2 (3.64%) Virtual Private Cloud
Communications & Networking
1 11 (20.00%) Firewall
2 7 (12.73%) DNS
3 5 (9.09%) DHCP
4 2 (3.64%) FTP
4 2 (3.64%) HTTP
4 2 (3.64%) SMTP
4 2 (3.64%) SSH
4 2 (3.64%) TCP/IP
4 2 (3.64%) VPN
5 1 (1.82%) Intrusion Detection
5 1 (1.82%) Network Security
5 1 (1.82%) SD-WAN
5 1 (1.82%) WAN
Database & Business Intelligence
1 15 (27.27%) Power BI
2 14 (25.45%) SQL Server
3 6 (10.91%) SQL Server Integration Services
4 3 (5.45%) PostgreSQL
5 2 (3.64%) Amazon RDS
5 2 (3.64%) Big Data
5 2 (3.64%) Data Hub
5 2 (3.64%) Data Lake
5 2 (3.64%) Data Warehouse
5 2 (3.64%) Metadata
5 2 (3.64%) MySQL
5 2 (3.64%) Relational Database
5 2 (3.64%) Tableau
6 1 (1.82%) Azure SQL Database
6 1 (1.82%) Looker
6 1 (1.82%) MongoDB
6 1 (1.82%) NoSQL
6 1 (1.82%) Power Query
6 1 (1.82%) SAS EBI
6 1 (1.82%) Semantic Layer
Development Applications
1 6 (10.91%) Git
2 3 (5.45%) Jenkins
3 2 (3.64%) JIRA
3 2 (3.64%) Sonatype Nexus
3 2 (3.64%) Vagrant
4 1 (1.82%) Bitbucket
General
1 22 (40.00%) Finance
2 17 (30.91%) Social Skills
3 11 (20.00%) Analytical Skills
4 9 (16.36%) Presentation Skills
5 8 (14.55%) Legal
5 8 (14.55%) Organisational Skills
6 7 (12.73%) Games
6 7 (12.73%) Marketing
7 4 (7.27%) Humanities
8 3 (5.45%) Law
9 1 (1.82%) Health Technology
9 1 (1.82%) Manufacturing
Job Titles
1 13 (23.64%) Lead
2 10 (18.18%) Developer
3 9 (16.36%) Analyst
4 7 (12.73%) Architect
5 4 (7.27%) Applications Architect
5 4 (7.27%) IT Architect
5 4 (7.27%) Senior
6 3 (5.45%) Cybersecurity Analyst
6 3 (5.45%) Data Analyst
6 3 (5.45%) Dynamics 365 Developer
6 3 (5.45%) Full-Stack Developer
6 3 (5.45%) Integration Developer
6 3 (5.45%) Junior
6 3 (5.45%) Security Analyst
6 3 (5.45%) Service Analyst
6 3 (5.45%) Service Desk Analyst
7 2 (3.64%) Azure Engineer
7 2 (3.64%) DevOps Engineer
7 2 (3.64%) Governance Analyst
7 2 (3.64%) Platform Engineer
Libraries, Frameworks & Software Standards
1 8 (14.55%) .NET
2 3 (5.45%) React
2 3 (5.45%) Web Services
3 2 (3.64%) .NET Core
3 2 (3.64%) .NET Framework
3 2 (3.64%) CSS
3 2 (3.64%) Node.js
3 2 (3.64%) RESTful
4 1 (1.82%) ARM Templates
4 1 (1.82%) Hibernate
4 1 (1.82%) HTML
4 1 (1.82%) Lightning Web Components
4 1 (1.82%) Middleware
4 1 (1.82%) Next.js
4 1 (1.82%) PySpark
4 1 (1.82%) REST
4 1 (1.82%) Sequelize
4 1 (1.82%) SOAP
4 1 (1.82%) Spring
4 1 (1.82%) Tailwind CSS
Miscellaneous
1 7 (12.73%) Greenfield Project
2 4 (7.27%) Replication
3 3 (5.45%) Data Centre
4 2 (3.64%) Cloud Native
4 2 (3.64%) Clustering
4 2 (3.64%) PKI
5 1 (1.82%) AS400
5 1 (1.82%) CMDB
5 1 (1.82%) Cyber Defence
5 1 (1.82%) Hybrid Cloud
5 1 (1.82%) NHS
5 1 (1.82%) Public Cloud
Operating Systems
1 9 (16.36%) Windows
2 6 (10.91%) Linux
3 5 (9.09%) Windows Server
4 2 (3.64%) Amazon Linux
4 2 (3.64%) VMS
Processes & Methodologies
1 19 (34.55%) Data Governance
2 17 (30.91%) Agile
3 15 (27.27%) Business Intelligence
3 15 (27.27%) Data Management
4 13 (23.64%) Migration
5 11 (20.00%) Mentoring
6 10 (18.18%) Problem-Solving
7 9 (16.36%) Coaching
7 9 (16.36%) DevOps
8 8 (14.55%) Data Security
8 8 (14.55%) Data Validation
8 8 (14.55%) Validation
9 7 (12.73%) Creative Thinking
9 7 (12.73%) Data Lineage
9 7 (12.73%) Data Privacy
9 7 (12.73%) ERP
9 7 (12.73%) Marketing Automation
9 7 (12.73%) Practice Management
9 7 (12.73%) Regulatory Compliance
9 7 (12.73%) Risk Management
Programming Languages
1 12 (21.82%) SQL
2 9 (16.36%) Python
3 7 (12.73%) C#
4 5 (9.09%) JavaScript
4 5 (9.09%) PowerShell
5 3 (5.45%) Java
5 3 (5.45%) VB.NET
6 2 (3.64%) Groovy
6 2 (3.64%) Perl
6 2 (3.64%) TypeScript
7 1 (1.82%) Apex Code
7 1 (1.82%) Bicep
7 1 (1.82%) Data Analysis Expressions
7 1 (1.82%) R
Qualifications
1 9 (16.36%) Degree
2 7 (12.73%) Azure Certification
3 3 (5.45%) Cisco Certification
3 3 (5.45%) SC Cleared
3 3 (5.45%) Security Cleared
4 2 (3.64%) (ISC)2 CCSP
4 2 (3.64%) AWS Certification
4 2 (3.64%) CCSP
4 2 (3.64%) CEH
4 2 (3.64%) CISA
4 2 (3.64%) CISM
4 2 (3.64%) CISSP
4 2 (3.64%) Microsoft Certification
5 1 (1.82%) CCNA
5 1 (1.82%) GIAC
5 1 (1.82%) HND
5 1 (1.82%) MCP
5 1 (1.82%) MCSA
5 1 (1.82%) MCSE
5 1 (1.82%) Postgraduate
Quality Assurance & Compliance
1 12 (21.82%) Data Quality
2 9 (16.36%) Accessibility
3 3 (5.45%) GRC
3 3 (5.45%) SLA
4 2 (3.64%) Cyber Essentials
4 2 (3.64%) Cyber Essentials PLUS
4 2 (3.64%) ISO/IEC 27001
4 2 (3.64%) PCI DSS
5 1 (1.82%) QA
System Software
1 8 (14.55%) Active Directory
2 6 (10.91%) Docker
3 5 (9.09%) Hyper-V
4 2 (3.64%) DFS Replication
4 2 (3.64%) VMware ESXi
4 2 (3.64%) VMware Infrastructure
5 1 (1.82%) Virtual Machines
5 1 (1.82%) Virtual Servers
Systems Management
1 4 (7.27%) Terraform
2 2 (3.64%) Failover Clustering
2 2 (3.64%) Grafana
2 2 (3.64%) Microsoft Intune
2 2 (3.64%) Prometheus
3 1 (1.82%) Kubernetes
3 1 (1.82%) Single Sign-On
Vendors
1 16 (29.09%) Microsoft
2 7 (12.73%) Databricks
3 2 (3.64%) Cisco
3 2 (3.64%) Google
3 2 (3.64%) Palo Alto
3 2 (3.64%) ServiceNow
3 2 (3.64%) Tenable
3 2 (3.64%) VMware
4 1 (1.82%) ForeScout
4 1 (1.82%) Informatica
4 1 (1.82%) Salesforce
4 1 (1.82%) Talend