Security Cleared Contract Job Trends in Reading

Security Clearance
Berkshire > Reading

The table below provides summary statistics for contract job vacancies advertised in Reading with a requirement for Security Cleared qualifications. It includes a benchmarking guide to the contractor rates offered over the 6 months leading up to 26 November 2025, comparing them to the same period in the previous two years.

6 months to
26 Nov 2025
Same period 2024 Same period 2023
Rank 2 1 1
Rank change year-on-year -1 0 +3
Contract jobs citing Security Cleared 160 273 289
As % of all contract jobs in Reading 23.81% 24.82% 27.87%
As % of the Qualifications category 68.09% 69.29% 66.44%
Number of daily rates quoted 121 153 194
10th Percentile £250 £426 £205
25th Percentile £306 £558 £280
Median daily rate (50th Percentile) £500 £605 £530
Median % change year-on-year -17.36% +14.15% -3.64%
75th Percentile £538 £675 £618
90th Percentile £615 £738 £662
Berkshire median daily rate £492 £583 £525
% change year-on-year -15.61% +11.05% -6.25%
Number of hourly rates quoted 16 20 13
10th Percentile £60.13 £48.18 £58.98
25th Percentile £68.75 £60.80 £60.82
Median hourly rate £90.00 £79.12 £63.29
Median % change year-on-year +13.75% +25.02% +15.07%
75th Percentile £95.00 £100.00 £67.75
90th Percentile £97.50 - £75.20
Berkshire median hourly rate £72.00 £63.15 £63.29
% change year-on-year +14.01% -0.22% +175.17%

All Academic and Professional Certifications
Reading

Security Cleared falls under the Academic Qualifications and Professional Certifications category. For comparison with the information above, the following table provides summary statistics for all contract job vacancies requiring academic qualifications or professional certifications in Reading.

Contract vacancies requiring academic qualifications or professional certifications 235 394 435
As % of all contract IT jobs advertised in Reading 34.97% 35.82% 41.95%
Number of daily rates quoted 159 207 290
10th Percentile £255 £350 £210
25th Percentile £354 £500 £368
Median daily rate (50th Percentile) £500 £605 £538
Median % change year-on-year -17.29% +12.47% -1.68%
75th Percentile £538 £675 £623
90th Percentile £619 £738 £688
Berkshire median daily rate £492 £575 £520
% change year-on-year -14.43% +10.58% -4.67%
Number of hourly rates quoted 19 20 13
10th Percentile £63.05 £48.18 £58.98
25th Percentile £71.00 £60.80 £60.82
Median hourly rate £90.00 £79.12 £63.29
Median % change year-on-year +13.75% +25.02% +15.07%
75th Percentile £95.00 £100.00 £67.75
90th Percentile £98.00 - £75.20
Berkshire median hourly rate £65.00 £61.76 £63.29
% change year-on-year +5.25% -2.42% +181.29%

Security Cleared
Job Vacancy Trend in Reading

Historical trend showing the proportion of contract IT job postings citing Security Cleared relative to all contract IT jobs advertised in Reading.
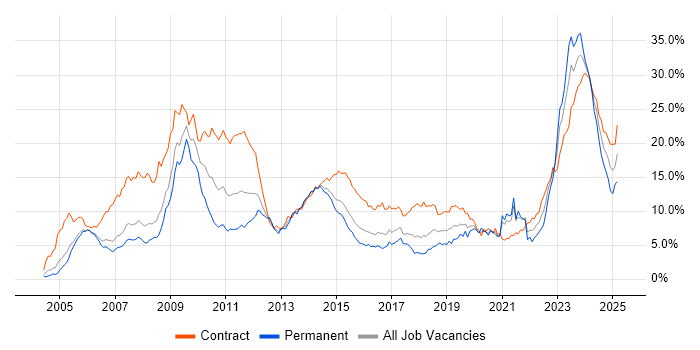
Security Cleared job vacancy trend in Reading

Security Cleared
Daily Rate Trend in Reading

Contractor daily rate distribution trend for jobs in Reading citing Security Cleared.

Contractor daily rate distribution trend for jobs in Reading citing Security Cleared

Security Cleared
Daily Rate Histogram in Reading

Daily rate distribution for jobs citing Security Cleared in Reading over the 6 months to 26 November 2025.

Daily rate histogram for Security Cleared in Reading

Security Cleared
Hourly Rate Trend in Reading

Contractor hourly rate distribution trend for jobs in Reading citing Security Cleared.

Contractor hourly rate distribution trend for jobs in Reading citing Security Cleared

Security Cleared
Hourly Rate Histogram in Reading

Hourly rate distribution of jobs citing Security Cleared in Reading over the 6 months to 26 November 2025.

Hourly rate histogram for Security Cleared in Reading

Security Cleared
Co-Occurring Skills & Capabilities in Reading by Category

The following tables expand on the one above by listing co-occurrences grouped by category. They cover the same employment type, locality and period, with up to 20 co-occurrences shown in each category:

Application Platforms
1 5 (3.13%) Microsoft Exchange
2 2 (1.25%) SharePoint
3 1 (0.63%) CMS
3 1 (0.63%) Drupal
3 1 (0.63%) Skype for Business
3 1 (0.63%) WordPress
Applications
1 1 (0.63%) Microsoft Excel
1 1 (0.63%) Microsoft Office
1 1 (0.63%) Microsoft PowerPoint
Business Applications
1 3 (1.88%) SAP S/4HANA
2 2 (1.25%) SAP HCM
2 2 (1.25%) SAP PS
3 1 (0.63%) Infor CloudSuite Industrial (formerly SyteLine)
3 1 (0.63%) Oracle ERP
3 1 (0.63%) Primavera
3 1 (0.63%) SAP EWM
3 1 (0.63%) SAP QM
Cloud Services
1 31 (19.38%) AWS
1 31 (19.38%) Azure
2 15 (9.38%) OneDrive
3 12 (7.50%) GCP
4 9 (5.63%) Entra ID
4 9 (5.63%) Microsoft 365
5 4 (2.50%) OpenShift
5 4 (2.50%) Power Automate
5 4 (2.50%) Power Platform
6 3 (1.88%) AWS CloudFormation
7 2 (1.25%) Azure DevOps
7 2 (1.25%) PowerApps
7 2 (1.25%) SaaS
7 2 (1.25%) Slack
8 1 (0.63%) Azure Data Factory
8 1 (0.63%) Azure Functions
8 1 (0.63%) Boomi
8 1 (0.63%) GitHub
8 1 (0.63%) IaaS
8 1 (0.63%) Serverless
Communications & Networking
1 10 (6.25%) Unified Communications
2 9 (5.63%) 4G
2 9 (5.63%) Wi-Fi
3 8 (5.00%) Firewall
4 5 (3.13%) DNS
4 5 (3.13%) WebEx
5 4 (2.50%) DHCP
6 3 (1.88%) LAN
6 3 (1.88%) Network Security
6 3 (1.88%) TCP/IP
7 2 (1.25%) DWDM
7 2 (1.25%) SAN
7 2 (1.25%) Wireless
8 1 (0.63%) CTI
8 1 (0.63%) Ethernet
8 1 (0.63%) H.323
8 1 (0.63%) Internet
8 1 (0.63%) Intranet
8 1 (0.63%) SDH
8 1 (0.63%) VPN
Database & Business Intelligence
1 6 (3.75%) NoSQL
2 2 (1.25%) Power BI
2 2 (1.25%) SQL Server
3 1 (0.63%) Data Hub
3 1 (0.63%) MySQL
3 1 (0.63%) PostgreSQL
Development Applications
1 8 (5.00%) JIRA
2 2 (1.25%) Git
2 2 (1.25%) Jenkins
2 2 (1.25%) Visual Studio
3 1 (0.63%) GitLab
3 1 (0.63%) Rational DOORS
General
1 62 (38.75%) Social Skills
2 53 (33.13%) Public Sector
3 16 (10.00%) Analytical Skills
4 8 (5.00%) Legal
5 6 (3.75%) Finance
6 3 (1.88%) Aerospace
6 3 (1.88%) Telecoms
7 2 (1.25%) Manufacturing
8 1 (0.63%) Billing
8 1 (0.63%) Electronics
8 1 (0.63%) Influencing Skills
8 1 (0.63%) Marketing
8 1 (0.63%) Military
8 1 (0.63%) Pharmaceutical
8 1 (0.63%) Presentation Skills
Job Titles
1 44 (27.50%) Consultant
2 33 (20.63%) Network Consultant
3 15 (9.38%) Architect
4 13 (8.13%) Senior
5 12 (7.50%) Infrastructure Engineer
6 8 (5.00%) Analyst
6 8 (5.00%) Support Engineer
7 7 (4.38%) Administrator
7 7 (4.38%) Cloud Engineer
7 7 (4.38%) Infrastructure Support
7 7 (4.38%) Infrastructure Support Engineer
7 7 (4.38%) Project Manager
8 6 (3.75%) Developer
8 6 (3.75%) Lead
8 6 (3.75%) Technical Architect
8 6 (3.75%) Windows Engineer
8 6 (3.75%) Windows Infrastructure Engineer
8 6 (3.75%) Windows Support Engineer
9 5 (3.13%) DevOps Engineer
9 5 (3.13%) Network Engineer
Libraries, Frameworks & Software Standards
1 4 (2.50%) Loki
2 3 (1.88%) .NET
2 3 (1.88%) Web Services
3 2 (1.25%) .NET Core
3 2 (1.25%) AngularJS
3 2 (1.25%) jQuery
3 2 (1.25%) Node.js
3 2 (1.25%) React
3 2 (1.25%) RESTful
4 1 (0.63%) Elastic Stack
4 1 (0.63%) GraphQL
4 1 (0.63%) OAuth2
4 1 (0.63%) OpenID
4 1 (0.63%) REST
4 1 (0.63%) RFC 2544
4 1 (0.63%) SailPoint
4 1 (0.63%) scikit-learn
4 1 (0.63%) Spring Boot
4 1 (0.63%) TensorFlow
4 1 (0.63%) Vue
Miscellaneous
1 11 (6.88%) Cloud Native
2 8 (5.00%) Management Information System
3 7 (4.38%) PKI
4 5 (3.13%) Driving Licence
4 5 (3.13%) Handset
4 5 (3.13%) PMI
4 5 (3.13%) Security Operations Centre
5 4 (2.50%) Data Centre
5 4 (2.50%) Virtual Team
6 3 (1.88%) Cyber Threat
6 3 (1.88%) Onboarding
7 2 (1.25%) Data Protection Act
7 2 (1.25%) Enterprise Storage
7 2 (1.25%) Fibre Optics
7 2 (1.25%) Product Ownership
8 1 (0.63%) CESG
8 1 (0.63%) HP Storage
8 1 (0.63%) Private Cloud
8 1 (0.63%) Replication
8 1 (0.63%) Video Conferencing
Operating Systems
1 29 (18.13%) Windows
2 16 (10.00%) Linux
3 14 (8.75%) Windows 10
4 6 (3.75%) Red Hat Enterprise Linux
5 3 (1.88%) Windows Server
6 2 (1.25%) Android
6 2 (1.25%) Apple iOS
7 1 (0.63%) Mac OS
7 1 (0.63%) Windows Server 2012
7 1 (0.63%) Windows Server 2016
7 1 (0.63%) Windows Server 2019
Processes & Methodologies
1 45 (28.13%) Roadmaps
2 43 (26.88%) Stakeholder Engagement
3 38 (23.75%) Migration
4 29 (18.13%) Collaborative Working
5 22 (13.75%) Problem-Solving
6 20 (12.50%) CI/CD
7 19 (11.88%) Agile
8 18 (11.25%) ITSM
9 17 (10.63%) Service Management
10 16 (10.00%) Infrastructure Engineering
10 16 (10.00%) ITIL
11 15 (9.38%) Cybersecurity
12 13 (8.13%) Continuous Improvement
12 13 (8.13%) DevOps
12 13 (8.13%) Risk Management
13 11 (6.88%) DevSecOps
13 11 (6.88%) Project Management
13 11 (6.88%) TOGAF
14 10 (6.25%) Infrastructure as Code
14 10 (6.25%) SIEM
Programming Languages
1 25 (15.63%) Python
2 18 (11.25%) PowerShell
3 10 (6.25%) Bash
4 7 (4.38%) Java
5 6 (3.75%) SQL
6 5 (3.13%) C#
7 4 (2.50%) JavaScript
8 3 (1.88%) C
9 2 (1.25%) Ada
9 2 (1.25%) Assembly Language
9 2 (1.25%) MATLAB
9 2 (1.25%) Shell Script
10 1 (0.63%) C++
10 1 (0.63%) Go
10 1 (0.63%) Kusto Query Language
10 1 (0.63%) PHP
10 1 (0.63%) R
Qualifications
1 124 (77.50%) SC Cleared
2 18 (11.25%) DV Cleared
3 16 (10.00%) AWS Certification
4 12 (7.50%) Degree
5 8 (5.00%) CISSP
6 7 (4.38%) Azure Certification
7 6 (3.75%) Cisco Certification
7 6 (3.75%) PMP
8 5 (3.13%) CCNP
8 5 (3.13%) GIAC
8 5 (3.13%) MAPM
8 5 (3.13%) PMI Certification
8 5 (3.13%) TOGAF Certification
9 4 (2.50%) APMP
9 4 (2.50%) BPSS Clearance
9 4 (2.50%) CFCE
9 4 (2.50%) GCFA
9 4 (2.50%) GCIA
9 4 (2.50%) GCIH
10 3 (1.88%) VMware Certified Professional (VCP)
Quality Assurance & Compliance
1 11 (6.88%) ISO/IEC 27001
2 9 (5.63%) QA
3 8 (5.00%) NIST
4 7 (4.38%) GDPR
5 4 (2.50%) HIPAA
5 4 (2.50%) PMO
6 2 (1.25%) NCSC
6 2 (1.25%) NIST 800
6 2 (1.25%) RMADS
6 2 (1.25%) SLA
7 1 (0.63%) Def Stans
7 1 (0.63%) EU AI Act
7 1 (0.63%) ISO/IEC 27002 (supersedes ISO/IEC 17799)
7 1 (0.63%) PCI DSS
7 1 (0.63%) PSD2
System Software
1 25 (15.63%) Active Directory
2 8 (5.00%) VMware Infrastructure
3 7 (4.38%) Docker
4 5 (3.13%) vSphere
5 3 (1.88%) Hyper-V
6 1 (0.63%) Virtual Machines
6 1 (0.63%) VMware NSX
Systems Management
1 14 (8.75%) Kubernetes
2 13 (8.13%) SCCM
3 6 (3.75%) Single Sign-On
4 5 (3.13%) Terraform
5 4 (2.50%) Ansible
5 4 (2.50%) Argo
5 4 (2.50%) Cisco CUCM
5 4 (2.50%) Computer Emergency Response Teams
5 4 (2.50%) Grafana
5 4 (2.50%) Kustomize
5 4 (2.50%) Prometheus
6 3 (1.88%) Microsoft Intune
7 2 (1.25%) NetBackup
8 1 (0.63%) Active Directory Federation Services
8 1 (0.63%) Cisco UCCE
8 1 (0.63%) Jamf Pro
8 1 (0.63%) Kibana
8 1 (0.63%) Nessus
8 1 (0.63%) vRealize
8 1 (0.63%) vRealize Orchestrator
Vendors
1 47 (29.38%) Cisco
2 40 (25.00%) Microsoft
3 34 (21.25%) Aruba
4 16 (10.00%) ServiceNow
5 13 (8.13%) VMware
6 8 (5.00%) Google
7 6 (3.75%) Red Hat
7 6 (3.75%) SAP
8 4 (2.50%) ArcSight
8 4 (2.50%) LogRhythm
8 4 (2.50%) Splunk
9 3 (1.88%) CrowdStrike
9 3 (1.88%) Nokia
9 3 (1.88%) Oracle
10 2 (1.25%) 3PAR
10 2 (1.25%) Dell
10 2 (1.25%) HP
10 2 (1.25%) Juniper
10 2 (1.25%) Veritas
11 1 (0.63%) F5