ETL Job Trends in the City of London

Extract, Transform and Load (ETL)
Central London > City of London

The table below provides summary statistics and salary benchmarking for jobs advertised in the City of London requiring ETL skills. It covers permanent job vacancies from the 6 months leading up to 22 November 2025, with comparisons to the same periods in the previous two years.

6 months to
22 Nov 2025
Same period 2024 Same period 2023
Rank 58 45 74
Rank change year-on-year -13 +29 -17
Permanent jobs citing ETL 72 156 110
As % of all permanent jobs in the City of London 4.09% 5.45% 3.63%
As % of the Processes & Methodologies category 4.42% 5.77% 3.81%
Number of salaries quoted 57 97 104
10th Percentile £47,750 £42,500 £52,500
25th Percentile £62,500 £55,000 £59,938
Median annual salary (50th Percentile) £85,000 £70,000 £76,325
Median % change year-on-year +21.43% -8.29% +9.04%
75th Percentile £95,000 £83,750 £105,000
90th Percentile £125,250 £97,500 £125,000
Central London median annual salary £85,000 £72,500 £75,150
% change year-on-year +17.24% -3.53% +7.36%

All Process and Methodology Skills
City of London

ETL falls under the Processes and Methodologies category. For comparison with the information above, the following table provides summary statistics for all permanent job vacancies requiring process or methodology skills in the City of London.

Permanent vacancies with a requirement for process or methodology skills 1,629 2,704 2,890
As % of all permanent jobs advertised in the City of London 92.45% 94.45% 95.41%
Number of salaries quoted 1,236 1,774 2,603
10th Percentile £40,000 £46,250 £41,250
25th Percentile £57,375 £55,000 £55,000
Median annual salary (50th Percentile) £75,000 £75,000 £75,000
75th Percentile £97,500 £95,000 £96,250
90th Percentile £120,000 £115,000 £115,000
Central London median annual salary £75,000 £75,000 £74,000
% change year-on-year - +1.35% -1.33%

ETL
Job Vacancy Trend in the City of London

Historical trend showing the proportion of permanent IT job postings citing ETL relative to all permanent IT jobs advertised in the City of London.
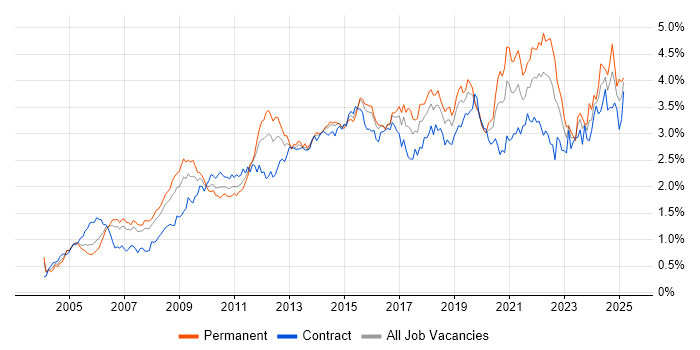
ETL job vacancy trend in the City of London

ETL
Salary Trend in the City of London

Salary distribution trend for jobs in the City of London citing ETL.

Salary distribution trend for jobs in the City of London citing ETL

ETL
Salary Histogram in the City of London

Salary distribution for jobs citing ETL in the City of London over the 6 months to 22 November 2025.

Salary histogram for ETL in the City of London

ETL
Co-Occurring Skills & Capabilities in the City of London by Category

The following tables expand on the one above by listing co-occurrences grouped by category. They cover the same employment type, locality and period, with up to 20 co-occurrences shown in each category:

Application Platforms
1 8 (11.11%) Apache Airflow
2 6 (8.33%) Apache Spark
3 4 (5.56%) Apache
4 3 (4.17%) Confluence
5 2 (2.78%) Luigi
6 1 (1.39%) IIS
6 1 (1.39%) Oracle SOA Suite
Applications
1 5 (6.94%) Microsoft Excel
Business Applications
1 3 (4.17%) Dynamics CRM
2 1 (1.39%) Oracle BPM
Cloud Services
1 50 (69.44%) Azure
2 36 (50.00%) Power Platform
3 23 (31.94%) Azure Data Factory
4 22 (30.56%) AWS
5 14 (19.44%) GCP
5 14 (19.44%) Snowflake
6 9 (12.50%) dbt
6 9 (12.50%) Serverless
7 8 (11.11%) Azure DevOps
7 8 (11.11%) Azure Synapse Analytics
8 7 (9.72%) Amazon S3
9 5 (6.94%) AWS Lambda
9 5 (6.94%) Dynamics 365
10 4 (5.56%) GitHub
11 3 (4.17%) Azure Functions
11 3 (4.17%) PaaS
11 3 (4.17%) PowerApps
12 2 (2.78%) Azure Logic Apps
12 2 (2.78%) Fivetran
12 2 (2.78%) Power Automate
Database & Business Intelligence
1 35 (48.61%) Power BI
2 31 (43.06%) Data Warehouse
3 23 (31.94%) SQL Server
4 17 (23.61%) Data Lake
5 9 (12.50%) SQL Server Integration Services
6 7 (9.72%) Power Query
7 6 (8.33%) Hadoop
7 6 (8.33%) NoSQL
8 5 (6.94%) Azure SQL Database
8 5 (6.94%) Delta Lake
8 5 (6.94%) Metadata
8 5 (6.94%) SQL Server Reporting Services
8 5 (6.94%) Tableau
9 4 (5.56%) Amazon Athena
9 4 (5.56%) Amazon Redshift
9 4 (5.56%) BigQuery
9 4 (5.56%) PostgreSQL
10 3 (4.17%) Data Mining
11 2 (2.78%) DataStage
11 2 (2.78%) Snowflake Schema
Development Applications
1 8 (11.11%) Git
2 5 (6.94%) JIRA
3 2 (2.78%) ER Studio
3 2 (2.78%) ERwin
3 2 (2.78%) Jenkins
3 2 (2.78%) PowerDesigner
4 1 (1.39%) Bitbucket
4 1 (1.39%) Deequ
4 1 (1.39%) GitLab
4 1 (1.39%) NUnit
4 1 (1.39%) Selenium
4 1 (1.39%) SpecFlow
4 1 (1.39%) Visual Studio
General
1 36 (50.00%) Finance
2 30 (41.67%) Social Skills
3 17 (23.61%) Analytical Skills
4 9 (12.50%) Influencing Skills
5 7 (9.72%) Banking
5 7 (9.72%) Inclusion and Diversity
6 5 (6.94%) Law
7 4 (5.56%) International Banking
7 4 (5.56%) Marketing
8 3 (4.17%) Financial Institution
8 3 (4.17%) Legal
8 3 (4.17%) Retail
9 2 (2.78%) Advertising
9 2 (2.78%) Public Sector
9 2 (2.78%) Retail Banking
9 2 (2.78%) Wearables
10 1 (1.39%) Games
10 1 (1.39%) Investment Banking
10 1 (1.39%) Manufacturing
Job Titles
1 36 (50.00%) Data Engineer
2 21 (29.17%) Senior
3 20 (27.78%) Senior Data Engineer
4 8 (11.11%) Developer
4 8 (11.11%) Lead
5 7 (9.72%) Architect
5 7 (9.72%) Data Architect
6 6 (8.33%) Business Intelligence Developer
7 5 (6.94%) Analyst
8 4 (5.56%) Data Analyst
9 3 (4.17%) Consultant
10 2 (2.78%) Analytics Consultant
10 2 (2.78%) AWS Engineer
10 2 (2.78%) Azure Engineer
10 2 (2.78%) Data Scientist
10 2 (2.78%) GCP Data Architect
10 2 (2.78%) Junior
10 2 (2.78%) Lead Data Engineer
10 2 (2.78%) Power BI Developer
10 2 (2.78%) Solutions Architect
Libraries, Frameworks & Software Standards
1 8 (11.11%) PySpark
2 4 (5.56%) Kafka
3 3 (4.17%) Pandas
3 3 (4.17%) XML
4 2 (2.78%) Django
4 2 (2.78%) Elastic Stack
4 2 (2.78%) RabbitMQ
4 2 (2.78%) React
5 1 (1.39%) ActiveMQ
5 1 (1.39%) AWS CDK
5 1 (1.39%) Great Expectations
5 1 (1.39%) LangChain
5 1 (1.39%) NumPy
5 1 (1.39%) pytest
5 1 (1.39%) PyTorch
5 1 (1.39%) TensorFlow
Miscellaneous
1 5 (6.94%) Reinsurance
2 4 (5.56%) Cloud Native
2 4 (5.56%) Credit Risk
2 4 (5.56%) Data Structures
2 4 (5.56%) Market Risk
3 2 (2.78%) Algorithms
3 2 (2.78%) Distributed Systems
3 2 (2.78%) Legacy Systems
3 2 (2.78%) Management Information System
3 2 (2.78%) Product Ownership
4 1 (1.39%) AI Agents
4 1 (1.39%) Data Fabric
4 1 (1.39%) Distributed Computing
4 1 (1.39%) Greenfield Project
4 1 (1.39%) Hybrid Cloud
4 1 (1.39%) Online Games
Operating Systems
1 1 (1.39%) Unix
Processes & Methodologies
1 49 (68.06%) Data Modelling
2 39 (54.17%) Data Pipeline
3 38 (52.78%) Analytics
4 35 (48.61%) Business Intelligence
5 32 (44.44%) Agile
6 29 (40.28%) Data Engineering
7 28 (38.89%) Decision-Making
8 20 (27.78%) Data Governance
8 20 (27.78%) DevOps
9 19 (26.39%) AI
9 19 (26.39%) Stakeholder Management
10 17 (23.61%) Problem-Solving
11 16 (22.22%) Data Science
12 14 (19.44%) CI/CD
13 13 (18.06%) Data Architecture
14 10 (13.89%) Data Analytics
14 10 (13.89%) Visualisation
15 9 (12.50%) Data Strategy
15 9 (12.50%) Machine Learning
15 9 (12.50%) Technical Leadership
Programming Languages
1 61 (84.72%) SQL
2 44 (61.11%) Python
3 16 (22.22%) Data Analysis Expressions
4 11 (15.28%) T-SQL
5 5 (6.94%) PowerShell
5 5 (6.94%) Scala
6 2 (2.78%) Java
7 1 (1.39%) C#
7 1 (1.39%) PL/SQL
Qualifications
1 6 (8.33%) Degree
2 5 (6.94%) Azure Certification
2 5 (6.94%) Microsoft Certification
3 4 (5.56%) AWS Certification
3 4 (5.56%) SnowPro
4 3 (4.17%) Computer Science Degree
4 3 (4.17%) DBS Check
5 2 (2.78%) Master's Degree
6 1 (1.39%) ISEB
6 1 (1.39%) ISTQB
6 1 (1.39%) Numerate Degree
6 1 (1.39%) SC Cleared
6 1 (1.39%) Security Cleared
6 1 (1.39%) TOGAF Certification
Quality Assurance & Compliance
1 12 (16.67%) Data Quality
2 3 (4.17%) GDPR
3 1 (1.39%) Accessibility
3 1 (1.39%) QA
Systems Management
1 4 (5.56%) Terraform
2 3 (4.17%) Puppet
3 2 (2.78%) Ansible
3 2 (2.78%) Progress Chef
4 1 (1.39%) Ambari
4 1 (1.39%) Grafana
4 1 (1.39%) HP ALM
4 1 (1.39%) ZABBIX
Vendors
1 27 (37.50%) Databricks
2 26 (36.11%) Microsoft
3 5 (6.94%) Google
4 4 (5.56%) Informatica
4 4 (5.56%) Oracle
5 2 (2.78%) IBM
6 1 (1.39%) Dell
6 1 (1.39%) HP
6 1 (1.39%) OpenAI
6 1 (1.39%) Salesforce
6 1 (1.39%) SAP
6 1 (1.39%) Siebel
6 1 (1.39%) Workday