High Availability Jobs in the City of London

High Availability
Central London > City of London

The table below provides summary statistics for permanent job vacancies advertised in the City of London requiring High Availability skills. It includes a benchmarking guide to the annual salaries offered in vacancies that cited High Availability over the 6 months leading up to 14 November 2024, comparing them to the same period in the previous two years.

6 months to
14 Nov 2024
Same period 2023 Same period 2022
Rank 113 136 244
Rank change year-on-year +23 +108 -32
Permanent jobs citing High Availability 64 53 44
As % of all permanent jobs advertised in the City of London 2.13% 1.63% 0.64%
As % of the Processes & Methodologies category 2.25% 1.71% 0.67%
Number of salaries quoted 40 44 40
10th Percentile £60,000 £57,500 £60,800
25th Percentile £72,500 £73,750 £72,500
Median annual salary (50th Percentile) £78,750 £83,750 £83,750
Median % change year-on-year -5.97% - +15.52%
75th Percentile £109,688 £91,250 £95,000
90th Percentile £137,500 £120,000 £120,000
Central London median annual salary £78,750 £77,500 £82,500
% change year-on-year +1.61% -6.06% +13.79%

All Process and Methodology Skills
City of London

High Availability falls under the Processes and Methodologies category. For comparison with the information above, the following table provides summary statistics for all permanent job vacancies requiring process or methodology skills in the City of London.

Permanent vacancies with a requirement for process or methodology skills 2,843 3,105 6,616
As % of all permanent jobs advertised in the City of London 94.67% 95.54% 95.95%
Number of salaries quoted 1,725 2,604 5,263
10th Percentile £46,250 £41,250 £45,250
25th Percentile £55,000 £55,000 £56,250
Median annual salary (50th Percentile) £75,000 £75,000 £75,000
Median % change year-on-year - - +3.45%
75th Percentile £95,000 £96,250 £95,000
90th Percentile £117,500 £115,000 £111,250
Central London median annual salary £75,000 £74,000 £75,000
% change year-on-year +1.35% -1.33% +7.14%

High Availability
Job Vacancy Trend in the City of London

Job postings citing High Availability as a proportion of all IT jobs advertised in the City of London.
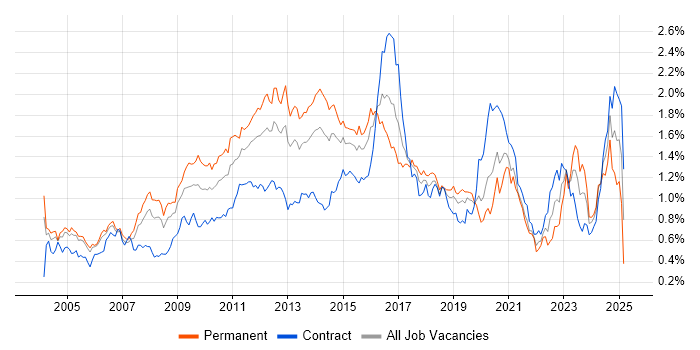
Job vacancy trend for High Availability in the City of London

High Availability
Salary Trend in the City of London

3-month moving average salary quoted in jobs citing High Availability in the City of London.

Salary trend for High Availability in the City of London

High Availability
Salary Histogram in the City of London

Salary distribution for jobs citing High Availability in the City of London over the 6 months to 14 November 2024.

Salary histogram for High Availability in the City of London

High Availability
Co-occurring Skills and Capabilities in the City of London by Category

The follow tables expand on the table above by listing co-occurrences grouped by category. The same employment type, locality and period is covered with up to 20 co-occurrences shown in each of the following categories:

Application Platforms
1 4 (6.25%) Microsoft Exchange
2 2 (3.13%) SharePoint
3 1 (1.56%) Exchange Server 2010
Business Applications
1 4 (6.25%) Payment Gateway
Cloud Services
1 42 (65.63%) Azure
2 18 (28.13%) AWS
3 8 (12.50%) OpenShift
4 6 (9.38%) Azure Synapse Analytics
5 5 (7.81%) Microsoft 365
6 4 (6.25%) GCP
7 3 (4.69%) SaaS
8 2 (3.13%) Azure AKS
8 2 (3.13%) Entra ID
8 2 (3.13%) GitHub
8 2 (3.13%) Serverless
9 1 (1.56%) AWS CloudFormation
9 1 (1.56%) Azure DevOps
9 1 (1.56%) OneDrive
9 1 (1.56%) WhatsApp
Communications & Networking
1 27 (42.19%) Firewall
2 20 (31.25%) 4G
2 20 (31.25%) LAN
2 20 (31.25%) VPN
3 14 (21.88%) Wi-Fi
4 11 (17.19%) DNS
4 11 (17.19%) Internet
4 11 (17.19%) WAN
4 11 (17.19%) Wireless
5 10 (15.63%) DHCP
5 10 (15.63%) Network Security
6 9 (14.06%) TCP/IP
7 3 (4.69%) BGP
8 2 (3.13%) Cisco ASA
8 2 (3.13%) Cisco IOS
8 2 (3.13%) Cisco ISE
8 2 (3.13%) Cisco Nexus
8 2 (3.13%) EIGRP
8 2 (3.13%) FCoE
8 2 (3.13%) NX-OS
Database & Business Intelligence
1 10 (15.63%) SQL Server
2 6 (9.38%) Data Lake
3 4 (6.25%) PostgreSQL
4 1 (1.56%) Elasticsearch
4 1 (1.56%) Metadata
4 1 (1.56%) MySQL
Development Applications
1 2 (3.13%) Sonatype Nexus
2 1 (1.56%) GitLab
General
1 20 (31.25%) Finance
1 20 (31.25%) Social Skills
2 3 (4.69%) Advertising
3 1 (1.56%) Analytical Skills
3 1 (1.56%) Banking
3 1 (1.56%) Documentation Skills
3 1 (1.56%) Law
3 1 (1.56%) Telecoms
Job Titles
1 19 (29.69%) Senior
2 15 (23.44%) Network Engineer
3 12 (18.75%) Infrastructure Engineer
4 11 (17.19%) Lead
5 8 (12.50%) Cisco Engineer
5 8 (12.50%) Senior Cisco Engineer
5 8 (12.50%) Virtualisation Engineer
6 6 (9.38%) Senior Network Engineer
6 6 (9.38%) Senior VMware Engineer
6 6 (9.38%) VMware Engineer
7 5 (7.81%) Data Engineer
7 5 (7.81%) Lead Data Engineer
7 5 (7.81%) Operations Manager
7 5 (7.81%) Senior Infrastructure Engineer
8 4 (6.25%) Developer
8 4 (6.25%) IT Manager
8 4 (6.25%) IT Operations Manager
9 3 (4.69%) Design Engineer
9 3 (4.69%) Java Engineer
9 3 (4.69%) Network Manager
Libraries, Frameworks & Software Standards
1 5 (7.81%) PySpark
2 4 (6.25%) .NET
2 4 (6.25%) Spring
2 4 (6.25%) Spring Boot
3 3 (4.69%) .NET Framework
3 3 (4.69%) React
3 3 (4.69%) YAML
4 1 (1.56%) ASP.NET
4 1 (1.56%) gRPC
4 1 (1.56%) Kafka
4 1 (1.56%) SwiftUI
Miscellaneous
1 11 (17.19%) CCTV
2 10 (15.63%) Self-Motivation
3 9 (14.06%) Data Centre
3 9 (14.06%) Security Operations Centre
4 4 (6.25%) Onboarding
5 3 (4.69%) Clustering
5 3 (4.69%) Private Cloud
6 2 (3.13%) Management Information System
6 2 (3.13%) Security Posture
7 1 (1.56%) Data Structures
7 1 (1.56%) Distributed Systems
7 1 (1.56%) Freedom of Information
7 1 (1.56%) Greenfield Project
7 1 (1.56%) Mobile App
7 1 (1.56%) Replication
7 1 (1.56%) Sports Betting
Operating Systems
1 16 (25.00%) Windows
2 9 (14.06%) Linux
3 7 (10.94%) Windows Server
4 3 (4.69%) Windows Server 2019
5 2 (3.13%) Apple iOS
5 2 (3.13%) Windows Server 2016
6 1 (1.56%) AIX
6 1 (1.56%) Android
6 1 (1.56%) Mac OS
6 1 (1.56%) Unix
6 1 (1.56%) Windows 10
6 1 (1.56%) Windows Server 2003
Processes & Methodologies
1 20 (31.25%) Business Continuity
1 20 (31.25%) Business Strategy
1 20 (31.25%) Mentoring
2 19 (29.69%) Infrastructure Management
3 15 (23.44%) Containerisation
4 13 (20.31%) Infrastructure Engineering
5 12 (18.75%) DevOps
5 12 (18.75%) Incident Management
6 11 (17.19%) Business Intelligence
6 11 (17.19%) Cost Management
6 11 (17.19%) ITIL
7 10 (15.63%) Technical Leadership
8 9 (14.06%) Data Privacy
8 9 (14.06%) Infrastructure Automation
8 9 (14.06%) Inventory Management
8 9 (14.06%) Preventative Maintenance
8 9 (14.06%) Proactive Maintenance
8 9 (14.06%) Security Operations
8 9 (14.06%) Software Licensing
8 9 (14.06%) Threat Intelligence
Programming Languages
1 17 (26.56%) Python
2 10 (15.63%) SQL
3 6 (9.38%) Java
3 6 (9.38%) PowerShell
4 5 (7.81%) T-SQL
5 2 (3.13%) Bash
5 2 (3.13%) Rust
5 2 (3.13%) TypeScript
6 1 (1.56%) Bicep
6 1 (1.56%) C#
6 1 (1.56%) C++
6 1 (1.56%) JavaScript
6 1 (1.56%) Korn
6 1 (1.56%) Swift
6 1 (1.56%) VB
6 1 (1.56%) VB.NET
6 1 (1.56%) VB6
Qualifications
1 19 (29.69%) Cisco Certification
2 10 (15.63%) Azure Certification
3 9 (14.06%) CCIE
3 9 (14.06%) CCNA
4 8 (12.50%) CCIE Data Center
4 8 (12.50%) RHCA
4 8 (12.50%) VCDX
5 6 (9.38%) Degree
6 4 (6.25%) Computer Science Degree
7 2 (3.13%) CCNP
8 1 (1.56%) CCIE Routing and Switching
8 1 (1.56%) DV Cleared
8 1 (1.56%) IBM Certification
8 1 (1.56%) LPIC
8 1 (1.56%) MCP
8 1 (1.56%) MCSE
8 1 (1.56%) Microsoft Certification
8 1 (1.56%) Security Cleared
Quality Assurance & Compliance
1 1 (1.56%) Cyber Essentials
1 1 (1.56%) GDPR
1 1 (1.56%) ISO/IEC 27001
1 1 (1.56%) NCSC
1 1 (1.56%) NIST
1 1 (1.56%) PCI DSS
System Software
1 16 (25.00%) Active Directory
1 16 (25.00%) VMware Infrastructure
2 8 (12.50%) vSphere
3 5 (7.81%) Hyper-V
4 3 (4.69%) Docker
5 1 (1.56%) VMware NSX
Systems Management
1 20 (31.25%) FortiGate
2 19 (29.69%) Terraform
3 18 (28.13%) Kubernetes
4 15 (23.44%) Ansible
5 2 (3.13%) Microsoft Intune
5 2 (3.13%) NetBackup
6 1 (1.56%) Nagios
6 1 (1.56%) Progress Chef
6 1 (1.56%) Puppet
6 1 (1.56%) Single Sign-On
6 1 (1.56%) vCenter Server
Vendors
1 18 (28.13%) VMware
2 17 (26.56%) Cisco
2 17 (26.56%) Microsoft
3 12 (18.75%) HP
4 11 (17.19%) Intel
5 8 (12.50%) Red Hat
6 2 (3.13%) EMC
6 2 (3.13%) NetApp
6 2 (3.13%) Palo Alto
6 2 (3.13%) SolarWinds
7 1 (1.56%) Apple
7 1 (1.56%) Commvault
7 1 (1.56%) Dell
7 1 (1.56%) ForgeRock
7 1 (1.56%) IBM
7 1 (1.56%) Meraki
7 1 (1.56%) Nimble Storage
7 1 (1.56%) Okta
7 1 (1.56%) Oracle
7 1 (1.56%) Ping Identity