Requirements Gathering Jobs in the City of London

Requirements Gathering (Requirements Elicitation)
Central London > City of London

The table below provides summary statistics for permanent job vacancies advertised in the City of London requiring Requirements Gathering skills. It includes a benchmarking guide to the annual salaries offered in vacancies that cited Requirements Gathering over the 6 months leading up to 14 November 2024, comparing them to the same period in the previous two years.

6 months to
14 Nov 2024
Same period 2023 Same period 2022
Rank 119 109 129
Rank change year-on-year -10 +20 -51
Permanent jobs citing Requirements Gathering 58 80 176
As % of all permanent jobs advertised in the City of London 1.93% 2.46% 2.55%
As % of the Processes & Methodologies category 2.04% 2.58% 2.66%
Number of salaries quoted 26 57 157
10th Percentile £43,750 £52,500 £49,000
25th Percentile £60,313 £65,000 £59,250
Median annual salary (50th Percentile) £73,750 £75,000 £75,000
Median % change year-on-year -1.67% - +20.00%
75th Percentile £80,000 £91,250 £90,000
90th Percentile £117,500 £100,000 £115,000
Central London median annual salary £75,000 £75,000 £75,000
% change year-on-year - - +17.65%

All Process and Methodology Skills
City of London

Requirements Gathering falls under the Processes and Methodologies category. For comparison with the information above, the following table provides summary statistics for all permanent job vacancies requiring process or methodology skills in the City of London.

Permanent vacancies with a requirement for process or methodology skills 2,843 3,105 6,616
As % of all permanent jobs advertised in the City of London 94.67% 95.54% 95.95%
Number of salaries quoted 1,725 2,604 5,263
10th Percentile £46,250 £41,250 £45,250
25th Percentile £55,000 £55,000 £56,250
Median annual salary (50th Percentile) £75,000 £75,000 £75,000
Median % change year-on-year - - +3.45%
75th Percentile £95,000 £96,250 £95,000
90th Percentile £117,500 £115,000 £111,250
Central London median annual salary £75,000 £74,000 £75,000
% change year-on-year +1.35% -1.33% +7.14%

Requirements Gathering
Job Vacancy Trend in the City of London

Job postings citing Requirements Gathering as a proportion of all IT jobs advertised in the City of London.
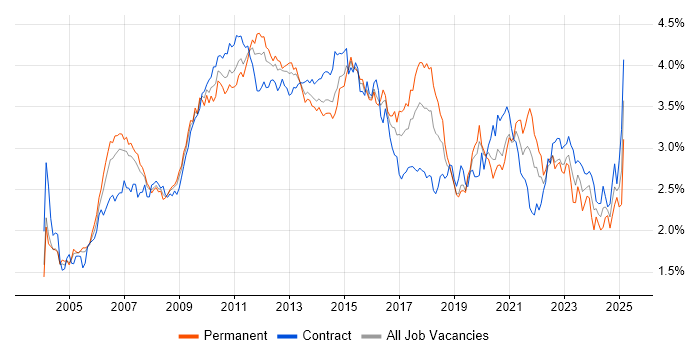
Job vacancy trend for Requirements Gathering in the City of London

Requirements Gathering
Salary Trend in the City of London

3-month moving average salary quoted in jobs citing Requirements Gathering in the City of London.

Salary trend for Requirements Gathering in the City of London

Requirements Gathering
Salary Histogram in the City of London

Salary distribution for jobs citing Requirements Gathering in the City of London over the 6 months to 14 November 2024.

Salary histogram for Requirements Gathering in the City of London

Requirements Gathering
Co-occurring Skills and Capabilities in the City of London by Category

The follow tables expand on the table above by listing co-occurrences grouped by category. The same employment type, locality and period is covered with up to 20 co-occurrences shown in each of the following categories:

Application Platforms
1 10 (17.24%) SAS
2 9 (15.52%) SharePoint
3 2 (3.45%) TPMS
4 1 (1.72%) Apache Airflow
Applications
1 8 (13.79%) Microsoft Excel
2 7 (12.07%) Microsoft Project
3 4 (6.90%) MS Visio
4 1 (1.72%) Microsoft PowerPoint
Business Applications
1 1 (1.72%) SAP Business ByDesign
Cloud Services
1 16 (27.59%) AWS
2 12 (20.69%) Azure
3 10 (17.24%) Amazon EC2
3 10 (17.24%) Amazon S3
4 5 (8.62%) Cloud Computing
5 4 (6.90%) Power Platform
5 4 (6.90%) SaaS
6 3 (5.17%) GCP
7 2 (3.45%) Microsoft 365
7 2 (3.45%) Power Automate
7 2 (3.45%) Snowflake
8 1 (1.72%) Asana
8 1 (1.72%) dbt
8 1 (1.72%) Dynamics 365
8 1 (1.72%) Entra ID
8 1 (1.72%) Figma
8 1 (1.72%) Fivetran
8 1 (1.72%) Matillion
8 1 (1.72%) PowerApps
Communications & Networking
1 3 (5.17%) TCP/IP
2 1 (1.72%) HTTP
Database & Business Intelligence
1 13 (22.41%) Data Warehouse
2 11 (18.97%) Amazon Redshift
2 11 (18.97%) Tableau
3 10 (17.24%) Amazon QuickSight
3 10 (17.24%) Data Mining
3 10 (17.24%) DynamoDB
3 10 (17.24%) NoSQL
4 5 (8.62%) Relational Database
5 4 (6.90%) Power BI
6 2 (3.45%) SQL Server
7 1 (1.72%) Enterprise Data Warehouse
7 1 (1.72%) Looker
Development Applications
1 2 (3.45%) JIRA
General
1 15 (25.86%) Analytical Skills
2 11 (18.97%) Social Skills
3 7 (12.07%) Finance
4 5 (8.62%) Banking
5 4 (6.90%) Law
5 4 (6.90%) Marketing
6 3 (5.17%) Front Office
7 2 (3.45%) Inclusion and Diversity
7 2 (3.45%) Presentation Skills
8 1 (1.72%) Agriculture
8 1 (1.72%) General Ledger
8 1 (1.72%) Legal
8 1 (1.72%) Public Sector
8 1 (1.72%) Retail
Job Titles
1 13 (22.41%) Consultant
2 11 (18.97%) Analyst
3 9 (15.52%) Business Analyst
4 8 (13.79%) Architect
5 5 (8.62%) Infrastructure Manager
5 5 (8.62%) Technical Infrastructure Manager
5 5 (8.62%) Technical Manager
6 4 (6.90%) CyberArk Consultant
6 4 (6.90%) ForgeRock Consultant
6 4 (6.90%) IAM Consultant
6 4 (6.90%) Principal Consultant
6 4 (6.90%) Security Consultant
6 4 (6.90%) Senior
7 3 (5.17%) Applications Architect
7 3 (5.17%) Data Analyst
7 3 (5.17%) Solutions Architect
8 2 (3.45%) Insurance Business Analyst
8 2 (3.45%) Product Manager
8 2 (3.45%) Senior Management Consultant
8 2 (3.45%) Senior Service Management Consultant
Libraries, Frameworks & Software Standards
1 5 (8.62%) REST
2 4 (6.90%) SailPoint
3 3 (5.17%) XML
4 2 (3.45%) HTML
4 2 (3.45%) React Native
4 2 (3.45%) SOAP
5 1 (1.72%) .NET
5 1 (1.72%) CSS
5 1 (1.72%) EDI
5 1 (1.72%) IDoc
5 1 (1.72%) JDBC
5 1 (1.72%) NumPy
5 1 (1.72%) Pandas
5 1 (1.72%) PySpark
5 1 (1.72%) Tailwind CSS
Miscellaneous
1 3 (5.17%) Low-Code
1 3 (5.17%) Onboarding
2 2 (3.45%) Mobile App
2 2 (3.45%) Product Ownership
3 1 (1.72%) Analytical Mindset
3 1 (1.72%) Cloud Native
3 1 (1.72%) Cyber Threat
3 1 (1.72%) Hedge funds
3 1 (1.72%) Public Cloud
3 1 (1.72%) Reinsurance
3 1 (1.72%) Virtual Team
Operating Systems
1 4 (6.90%) Linux
1 4 (6.90%) Windows
2 3 (5.17%) Mac OS
2 3 (5.17%) Unix
3 1 (1.72%) Windows Server
Processes & Methodologies
1 14 (24.14%) Business Intelligence
1 14 (24.14%) ETL
2 13 (22.41%) Analytics
3 12 (20.69%) Data Modelling
4 11 (18.97%) Data Engineering
4 11 (18.97%) Visualisation
5 10 (17.24%) Data Visualisation
5 10 (17.24%) Logistics
5 10 (17.24%) Performance Measurement
5 10 (17.24%) Process Improvement
5 10 (17.24%) Statistical Analysis
6 8 (13.79%) Roadmaps
6 8 (13.79%) Stakeholder Management
6 8 (13.79%) Technology Strategy
7 7 (12.07%) Artificial Intelligence
7 7 (12.07%) Problem-Solving
8 6 (10.34%) Business Case
8 6 (10.34%) Presales
8 6 (10.34%) Systems Analysis
9 5 (8.62%) Cybersecurity
Programming Languages
1 20 (34.48%) SQL
2 14 (24.14%) Python
3 10 (17.24%) MATLAB
3 10 (17.24%) R
4 6 (10.34%) Java
5 3 (5.17%) C#
5 3 (5.17%) Groovy
5 3 (5.17%) Shell Script
6 2 (3.45%) C++
7 1 (1.72%) PowerShell
Qualifications
1 10 (17.24%) Security Cleared
2 7 (12.07%) Degree
3 3 (5.17%) SC Cleared
4 2 (3.45%) BPSS Clearance
4 2 (3.45%) Microsoft Certification
5 1 (1.72%) DV Cleared
Quality Assurance & Compliance
1 8 (13.79%) QA
2 3 (5.17%) PMO
3 2 (3.45%) ISO/IEC 20000
4 1 (1.72%) Data Quality
System Software
1 2 (3.45%) Docker
2 1 (1.72%) Active Directory
Systems Management
1 2 (3.45%) Kubernetes
1 2 (3.45%) Terraform
2 1 (1.72%) Microsoft Intune
Vendors
1 10 (17.24%) Oracle
2 8 (13.79%) Microsoft
3 4 (6.90%) BeyondTrust
3 4 (6.90%) CyberArk
3 4 (6.90%) ForgeRock
3 4 (6.90%) Okta
3 4 (6.90%) OneLogin
3 4 (6.90%) Ping Identity
4 3 (5.17%) Murex
4 3 (5.17%) Salesforce
5 2 (3.45%) Salesforce Marketing Cloud
5 2 (3.45%) ServiceNow
6 1 (1.72%) Alteryx
6 1 (1.72%) Citrix
6 1 (1.72%) Databricks
6 1 (1.72%) Guidewire
6 1 (1.72%) NetApp
6 1 (1.72%) OpenAI
6 1 (1.72%) Veeam
6 1 (1.72%) VMware