Self-Motivation Jobs in the City of London

Self-Motivation
Central London > City of London

The table below looks at the prevalence of the term Self-Motivation in permanent job vacancies in the City of London. Included is a benchmarking guide to the salaries offered in vacancies that cited Self-Motivation over the 6 months leading up to 3 April 2025, comparing them to the same period in the previous two years.

6 months to
3 Apr 2025
Same period 2024 Same period 2023
Rank 87 101 128
Rank change year-on-year +14 +27 +1
Permanent jobs citing Self-Motivation 53 80 119
As % of all permanent jobs advertised in the City of London 2.52% 2.41% 2.36%
As % of the Miscellaneous category 6.12% 7.28% 5.77%
Number of salaries quoted 34 54 98
10th Percentile £35,000 £35,000 £39,400
25th Percentile £45,000 £42,000 £55,000
Median annual salary (50th Percentile) £50,000 £55,000 £80,000
Median % change year-on-year -9.09% -31.25% -
75th Percentile £58,438 £75,000 £105,000
90th Percentile £82,375 £97,500 £137,500
Central London median annual salary £50,000 £55,000 £77,500
% change year-on-year -9.09% -29.03% -3.13%

All Generic Skills
City of London

Self-Motivation falls under the General and Transferable Skills category. For comparison with the information above, the following table provides summary statistics for all permanent job vacancies requiring generic IT skills in the City of London.

Permanent vacancies with a requirement for generic IT skills 866 1,099 2,062
As % of all permanent jobs advertised in the City of London 41.24% 33.09% 40.84%
Number of salaries quoted 633 879 1,759
10th Percentile £41,250 £40,000 £45,000
25th Percentile £53,750 £52,500 £58,750
Median annual salary (50th Percentile) £72,500 £75,000 £77,500
Median % change year-on-year -3.33% -3.23% -
75th Percentile £98,750 £97,500 £102,500
90th Percentile £127,250 £118,750 £120,000
Central London median annual salary £72,500 £75,000 £77,500
% change year-on-year -3.33% -3.23% +3.33%

Self-Motivation
Job Vacancy Trend in the City of London

Job postings citing Self-Motivation as a proportion of all IT jobs advertised in the City of London.
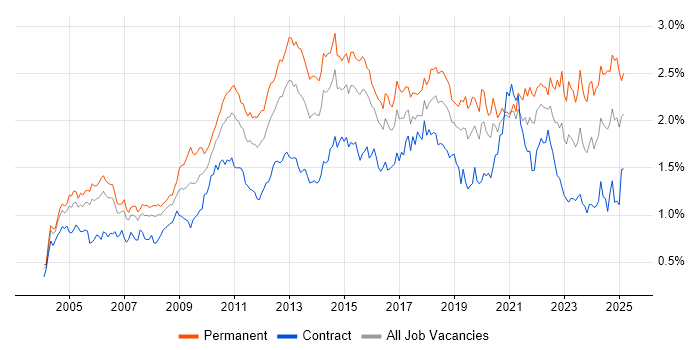
Job vacancy trend for Self-Motivation in the City of London

Self-Motivation
Salary Trend in the City of London

3-month moving average salary quoted in jobs citing Self-Motivation in the City of London.

Salary trend for Self-Motivation in the City of London

Self-Motivation
Salary Histogram in the City of London

Salary distribution for jobs citing Self-Motivation in the City of London over the 6 months to 3 April 2025.

Salary histogram for Self-Motivation in the City of London

Self-Motivation
Co-occurring Skills and Capabilities in the City of London by Category

The follow tables expand on the table above by listing co-occurrences grouped by category. The same employment type, locality and period is covered with up to 20 co-occurrences shown in each of the following categories:

Application Platforms
1 7 (13.21%) SharePoint
2 6 (11.32%) Microsoft Exchange
3 1 (1.89%) Confluence
3 1 (1.89%) Liferay
Applications
1 10 (18.87%) Microsoft Office
2 9 (16.98%) Microsoft Excel
3 7 (13.21%) Microsoft PowerPoint
4 1 (1.89%) Chatbot
Business Applications
1 2 (3.77%) Magento
Cloud Services
1 8 (15.09%) Microsoft 365
2 6 (11.32%) Google Ads
2 6 (11.32%) Google Analytics
2 6 (11.32%) Google Sheets
3 5 (9.43%) OneDrive
4 4 (7.55%) Azure
5 3 (5.66%) AWS
5 3 (5.66%) Cloud Computing
6 2 (3.77%) GCP
6 2 (3.77%) WhatsApp
7 1 (1.89%) Asana
7 1 (1.89%) Azure Data Factory
7 1 (1.89%) Azure DevOps
7 1 (1.89%) Azure Synapse Analytics
7 1 (1.89%) Dynamics 365
7 1 (1.89%) Entra ID
7 1 (1.89%) Google Workspace
7 1 (1.89%) Power Platform
7 1 (1.89%) Rubrik
Communications & Networking
1 7 (13.21%) Firewall
2 6 (11.32%) TCP/IP
3 5 (9.43%) Intrusion Detection
3 5 (9.43%) IPsec
3 5 (9.43%) SSL
3 5 (9.43%) Wireless
4 3 (5.66%) Network Security
5 2 (3.77%) Broadband
5 2 (3.77%) DHCP
5 2 (3.77%) DNS
5 2 (3.77%) LAN
5 2 (3.77%) VLAN
5 2 (3.77%) VoIP
5 2 (3.77%) VPN
5 2 (3.77%) WAN
5 2 (3.77%) WebEx
5 2 (3.77%) Wireshark
6 1 (1.89%) 4G
6 1 (1.89%) Internet
6 1 (1.89%) Remote Desktop
Database & Business Intelligence
1 6 (11.32%) SQL Server
2 4 (7.55%) Big Data
2 4 (7.55%) MySQL
3 2 (3.77%) Crystal Reports
3 2 (3.77%) GIS
3 2 (3.77%) MS Access
4 1 (1.89%) Data Lake
4 1 (1.89%) Data Warehouse
4 1 (1.89%) Power BI
4 1 (1.89%) SQL Server Integration Services
4 1 (1.89%) Star Schema
Development Applications
1 3 (5.66%) Visual Studio
2 2 (3.77%) Burp Suite
2 2 (3.77%) Git
2 2 (3.77%) Metasploit
3 1 (1.89%) Eclipse
3 1 (1.89%) JIRA
General
1 37 (69.81%) Social Skills
2 24 (45.28%) Analytical Skills
3 9 (16.98%) Banking
4 8 (15.09%) Finance
4 8 (15.09%) Law
5 7 (13.21%) Advertising
5 7 (13.21%) Marketing
5 7 (13.21%) Organisational Skills
6 5 (9.43%) Inclusion and Diversity
7 2 (3.77%) Games
7 2 (3.77%) Local Government
7 2 (3.77%) Presentation Skills
8 1 (1.89%) Documentation Skills
8 1 (1.89%) French Language
8 1 (1.89%) German Language
Job Titles
1 20 (37.74%) Analyst
2 7 (13.21%) Support Analyst
3 6 (11.32%) PPC Analyst
4 5 (9.43%) Developer
4 5 (9.43%) Security Analyst
4 5 (9.43%) Senior
5 4 (7.55%) Applications Support
5 4 (7.55%) Applications Support Analyst
5 4 (7.55%) SQL Analyst
5 4 (7.55%) SQL Support Analyst
6 3 (5.66%) 1st/2nd Line Support
6 3 (5.66%) 1st/2nd Line Support Analyst
6 3 (5.66%) 2nd Line Support
6 3 (5.66%) 2nd Line Support Analyst
6 3 (5.66%) IT Analyst
6 3 (5.66%) IT Support
6 3 (5.66%) IT Support Analyst
7 2 (3.77%) Penetration Tester
7 2 (3.77%) Service Desk Analyst
7 2 (3.77%) Team Leader
Libraries, Frameworks & Software Standards
1 6 (11.32%) .NET
2 2 (3.77%) LINQ
3 1 (1.89%) CSS
3 1 (1.89%) HTML
3 1 (1.89%) React
Miscellaneous
1 8 (15.09%) Photography
1 8 (15.09%) Video Editing
2 7 (13.21%) Social Media
3 5 (9.43%) Video Conferencing
4 3 (5.66%) Cyber Threat
4 3 (5.66%) Mobile App
4 3 (5.66%) Onboarding
5 2 (3.77%) Blog
5 2 (3.77%) Cyberattack
5 2 (3.77%) Greenfield Project
5 2 (3.77%) IoT
5 2 (3.77%) Robotics
6 1 (1.89%) Blockchain
6 1 (1.89%) Enterprise Storage
6 1 (1.89%) Hybrid Cloud
6 1 (1.89%) iPad
6 1 (1.89%) iPhone
6 1 (1.89%) Mobile Payment
6 1 (1.89%) Public Cloud
6 1 (1.89%) Security Operations Centre
Operating Systems
1 11 (20.75%) Windows
2 6 (11.32%) Linux
3 4 (7.55%) Unix
4 2 (3.77%) Kali Linux
4 2 (3.77%) Windows 10
4 2 (3.77%) Windows Server
5 1 (1.89%) Mac OS
Processes & Methodologies
1 32 (60.38%) Problem-Solving
2 11 (20.75%) Agile
2 11 (20.75%) Logistics
3 10 (18.87%) Continuous Improvement
3 10 (18.87%) Data Analysis
3 10 (18.87%) ITIL
4 8 (15.09%) Analytics
4 8 (15.09%) Collaborative Working
4 8 (15.09%) Data Analytics
4 8 (15.09%) Post-Production
5 7 (13.21%) Actionable Insight
5 7 (13.21%) Cybersecurity
5 7 (13.21%) Vulnerability Assessment
6 6 (11.32%) A/B Testing
6 6 (11.32%) Business Continuity
6 6 (11.32%) Campaign Management
6 6 (11.32%) Digital Marketing
6 6 (11.32%) Pay per click
6 6 (11.32%) Performance Monitoring
6 6 (11.32%) SEO
Programming Languages
1 7 (13.21%) SQL
2 4 (7.55%) Java
2 4 (7.55%) T-SQL
3 2 (3.77%) C#
3 2 (3.77%) PHP
3 2 (3.77%) Python
4 1 (1.89%) Bicep
4 1 (1.89%) JavaScript
Qualifications
1 15 (28.30%) Degree
2 7 (13.21%) GIAC
3 5 (9.43%) CompTIA CySA+
3 5 (9.43%) CompTIA Security+
3 5 (9.43%) MCSA
3 5 (9.43%) Microsoft Certification
4 2 (3.77%) CREST Certified
4 2 (3.77%) Cyber Scheme
4 2 (3.77%) GPEN
4 2 (3.77%) ITIL Foundation Certificate
4 2 (3.77%) Master's Degree
4 2 (3.77%) MBA
4 2 (3.77%) OSCP
4 2 (3.77%) OSWP
4 2 (3.77%) Six Sigma Black Belt
5 1 (1.89%) Azure Certification
5 1 (1.89%) CCNA
5 1 (1.89%) Cisco Certification
Quality Assurance & Compliance
1 5 (9.43%) ISO/IEC 27001
1 5 (9.43%) NCSC
2 3 (5.66%) QA
3 1 (1.89%) Data Quality
3 1 (1.89%) GDPR
3 1 (1.89%) SLA
3 1 (1.89%) Software Quality Assurance
System Software
1 8 (15.09%) Active Directory
2 3 (5.66%) VMware Infrastructure
3 1 (1.89%) Hyper-V
3 1 (1.89%) Virtual Desktop
3 1 (1.89%) Virtual Servers
Systems Management
1 5 (9.43%) Microsoft Intune
2 2 (3.77%) Nessus
2 2 (3.77%) Nmap
3 1 (1.89%) Avamar
3 1 (1.89%) FortiGate
3 1 (1.89%) NetBackup
3 1 (1.89%) Tivoli Storage Manager
Vendors
1 25 (47.17%) Microsoft
2 9 (16.98%) Google
3 6 (11.32%) Apple
3 6 (11.32%) VMware
4 5 (9.43%) HP
4 5 (9.43%) ServiceNow
5 4 (7.55%) Oracle
6 2 (3.77%) Minitab
7 1 (1.89%) Cognos
7 1 (1.89%) Sun
7 1 (1.89%) Veeam