Local Government Jobs in England

Local Government (Local Authority, Local Council)
UK > England

The table below looks at the prevalence of the term Local Government in permanent job vacancies in England. Included is a benchmarking guide to the salaries offered in vacancies that cited Local Government over the 6 months leading up to 15 November 2024, comparing them to the same period in the previous two years.

6 months to
15 Nov 2024
Same period 2023 Same period 2022
Rank 261 304 532
Rank change year-on-year +43 +228 +132
Permanent jobs citing Local Government 708 528 639
As % of all permanent jobs advertised in England 1.06% 1.06% 0.56%
As % of the General category 1.80% 1.63% 0.82%
Number of salaries quoted 119 358 424
10th Percentile £32,000 £26,000 £30,250
25th Percentile £40,514 £26,500 £38,386
Median annual salary (50th Percentile) £48,750 £30,000 £45,551
Median % change year-on-year +62.50% -34.14% +7.69%
75th Percentile £58,773 £49,894 £63,037
90th Percentile £73,750 £62,963 £75,000
UK median annual salary £45,680 £26,500 £42,773
% change year-on-year +72.38% -38.05% +0.64%

All General Skills
England

Local Government falls under the General Skills category. For comparison with the information above, the following table provides summary statistics for all permanent job vacancies requiring common skills in England.

Permanent vacancies with a requirement for common skills 39,382 32,452 78,338
As % of all permanent jobs advertised in England 59.15% 65.37% 68.30%
Number of salaries quoted 17,705 22,900 45,027
10th Percentile £32,500 £31,250 £32,500
25th Percentile £43,750 £42,500 £45,000
Median annual salary (50th Percentile) £60,000 £60,000 £60,000
75th Percentile £80,000 £82,500 £82,500
90th Percentile £100,000 £102,500 £101,250
UK median annual salary £60,000 £60,000 £60,000
% change year-on-year - - +4.35%

Local Government
Job Vacancy Trend in England

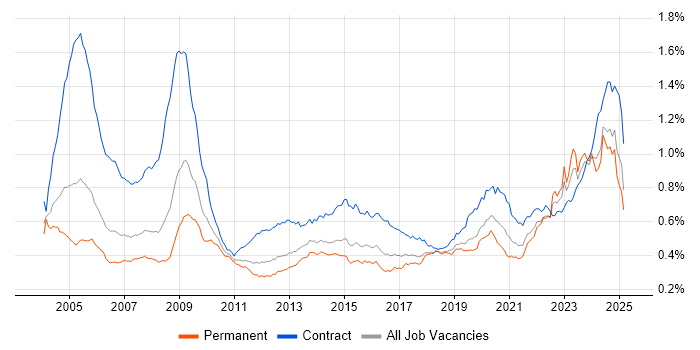
Job postings citing Local Government as a proportion of all IT jobs advertised in England.

Job vacancy trend for Local Government in England

Local Government
Salary Trend in England

3-month moving average salary quoted in jobs citing Local Government in England.

Salary trend for Local Government in England

Local Government
Salary Histogram in England

Salary distribution for jobs citing Local Government in England over the 6 months to 15 November 2024.

Salary histogram for Local Government in England

Local Government
Job Locations in England

The table below looks at the demand and provides a guide to the median salaries quoted in IT jobs citing Local Government within the England region over the 6 months to 15 November 2024. The 'Rank Change' column provides an indication of the change in demand within each location based on the same 6 month period last year.

Location Rank Change
on Same Period
Last Year
Matching
Permanent
IT Job Ads
Median Salary
Past 6 Months
Median Salary
% Change
on Same Period
Last Year
Live
Jobs
North of England +88 213 £45,000 +50.00% 34
London +39 196 £53,500 +35.55% 54
North West +29 128 £40,000 -15.79% 27
Midlands -59 128 £57,500 +116.98% 17
West Midlands -48 107 £63,504 +139.64% 6
South East +47 105 £44,090 +6.52% 38
Yorkshire +71 77 £45,445 +51.48% 6
East of England -30 38 £36,345 -14.48% 14
East Midlands -48 21 £57,500 +116.98% 11
South West -40 13 £42,923 +1.00% 18
North East -34 8 £32,501 +30.00% 1
Local Government
UK

Local Government
Co-occurring Skills and Capabilities in England by Category

The follow tables expand on the table above by listing co-occurrences grouped by category. The same employment type, locality and period is covered with up to 20 co-occurrences shown in each of the following categories:

Application Platforms
1 22 (3.11%) SharePoint
2 6 (0.85%) Skype for Business
3 3 (0.42%) Apache
3 3 (0.42%) IIS
3 3 (0.42%) Tomcat
4 2 (0.28%) CMS
5 1 (0.14%) ArcGIS
5 1 (0.14%) Confluence
5 1 (0.14%) Moodle
Applications
1 18 (2.54%) Microsoft Office
2 8 (1.13%) Microsoft Excel
3 1 (0.14%) AutoCAD
3 1 (0.14%) Microsoft PowerPoint
3 1 (0.14%) Microsoft Project
3 1 (0.14%) Spreadsheet
Business Applications
1 339 (47.88%) NEC Housing
2 4 (0.56%) Unit4 Business World
3 1 (0.14%) Academy Revenues and Benefits
3 1 (0.14%) iTrent
Cloud Services
1 41 (5.79%) Microsoft 365
2 34 (4.80%) Azure
3 28 (3.95%) Figma
3 28 (3.95%) SaaS
4 16 (2.26%) Power Platform
5 4 (0.56%) Cloud Computing
6 3 (0.42%) Facebook Ads
6 3 (0.42%) Google Ads
6 3 (0.42%) Google Workspace
6 3 (0.42%) OneDrive
7 2 (0.28%) AWS
7 2 (0.28%) Azure Data Factory
7 2 (0.28%) Azure Synapse Analytics
7 2 (0.28%) Boomi
7 2 (0.28%) GCP
7 2 (0.28%) IaaS
7 2 (0.28%) iPaaS
7 2 (0.28%) PaaS
8 1 (0.14%) Dynamics 365
8 1 (0.14%) Entra ID
Communications & Networking
1 23 (3.25%) Firewall
2 18 (2.54%) WAN
3 14 (1.98%) LAN
3 14 (1.98%) SD-WAN
4 13 (1.84%) VPN
5 6 (0.85%) Skype
5 6 (0.85%) Wireless
6 4 (0.56%) IPsec
6 4 (0.56%) MPLS
6 4 (0.56%) NAS
6 4 (0.56%) NetScaler
6 4 (0.56%) SAN
6 4 (0.56%) VLAN
6 4 (0.56%) Wi-Fi
7 2 (0.28%) Network Security
7 2 (0.28%) Structured Cabling
8 1 (0.14%) Cisco ISE
8 1 (0.14%) Internet
8 1 (0.14%) Unified Communications
8 1 (0.14%) WPA
Database & Business Intelligence
1 70 (9.89%) BusinessObjects
2 55 (7.77%) Oracle Database
3 14 (1.98%) Power BI
4 8 (1.13%) Tableau
5 6 (0.85%) Data Warehouse
5 6 (0.85%) SQL Server
6 5 (0.71%) Big Data
7 4 (0.56%) GIS
8 3 (0.42%) Relational Database
8 3 (0.42%) Semantic Layer
9 2 (0.28%) Data Hub
9 2 (0.28%) Metadata
9 2 (0.28%) Metadata Repository
9 2 (0.28%) Oracle Reports
9 2 (0.28%) SQL Server Integration Services
10 1 (0.14%) Data Lake
10 1 (0.14%) QGIS
10 1 (0.14%) Spatial Data
10 1 (0.14%) SQL Server Reporting Services
Development Applications
1 30 (4.24%) JIRA
2 10 (1.41%) Oracle APEX
3 1 (0.14%) RStudio
General
1 440 (62.15%) Public Sector
2 391 (55.23%) Finance
3 335 (47.32%) Police
4 188 (26.55%) Social Housing
5 159 (22.46%) Social Skills
6 79 (11.16%) Presentation Skills
7 49 (6.92%) Retail
8 43 (6.07%) Analytical Skills
9 22 (3.11%) Telecoms
10 16 (2.26%) Organisational Skills
11 14 (1.98%) Inclusion and Diversity
12 11 (1.55%) Marketing
13 10 (1.41%) Influencing Skills
14 9 (1.27%) Military
15 7 (0.99%) Legal
16 6 (0.85%) Advertising
16 6 (0.85%) Fire and Rescue
16 6 (0.85%) Law
17 5 (0.71%) Manufacturing
18 2 (0.28%) Back Office
Job Titles
1 273 (38.56%) Consultant
2 195 (27.54%) Implementation Consultant
3 119 (16.81%) Senior
4 72 (10.17%) Senior Consultant
5 68 (9.60%) Senior Support Consultant
5 68 (9.60%) Support Consultant
6 66 (9.32%) Project Manager
7 56 (7.91%) Business Manager
8 53 (7.49%) Business Development Manager
8 53 (7.49%) Development Manager
9 39 (5.51%) Technical Consultant
9 39 (5.51%) Technical Implementation Consultant
10 32 (4.52%) Product Manager
11 26 (3.67%) Lead
12 25 (3.53%) Developer
13 22 (3.11%) Analyst
13 22 (3.11%) Audit Manager
14 14 (1.98%) Team Leader
15 13 (1.84%) Designer
15 13 (1.84%) Oracle Developer
Libraries, Frameworks & Software Standards
1 13 (1.84%) JSON
1 13 (1.84%) XML
2 12 (1.69%) CSS
2 12 (1.69%) HTML
2 12 (1.69%) SOAP
3 10 (1.41%) REST
3 10 (1.41%) Ruby on Rails
4 7 (0.99%) Web Services
5 3 (0.42%) .NET
5 3 (0.42%) Middleware
5 3 (0.42%) Oracle Fusion
6 2 (0.28%) .NET Core
6 2 (0.28%) .NET Framework
6 2 (0.28%) Code First Entity Framework
6 2 (0.28%) Entity Framework
6 2 (0.28%) OAuth
6 2 (0.28%) OAuth2
6 2 (0.28%) Razor View Engine
7 1 (0.14%) EDI
7 1 (0.14%) Java SE
Miscellaneous
1 166 (23.45%) Housing Association
2 63 (8.90%) Driving Licence
3 46 (6.50%) iPad
4 30 (4.24%) Mobile App
5 28 (3.95%) Onboarding
6 27 (3.81%) NHS
7 23 (3.25%) Self-Motivation
8 14 (1.98%) Management Information System
9 12 (1.69%) Social Media
10 6 (0.85%) Data Protection Act
11 5 (0.71%) Data Centre
12 4 (0.56%) Data Structures
12 4 (0.56%) Educational Technology
12 4 (0.56%) Replication
13 3 (0.42%) Blog
13 3 (0.42%) Hybrid Cloud
13 3 (0.42%) IoT
13 3 (0.42%) Over-the-Top Content
13 3 (0.42%) Public Cloud
14 2 (0.28%) Learning Management System
Operating Systems
1 159 (22.46%) Unix
2 105 (14.83%) Windows
3 81 (11.44%) Linux
4 71 (10.03%) Solaris
5 9 (1.27%) Windows 10
6 4 (0.56%) Windows Server
7 1 (0.14%) Windows Vista
Processes & Methodologies
1 252 (35.59%) Housing Management
2 100 (14.12%) Customer Requirements
3 86 (12.15%) Agile
4 81 (11.44%) Project Management
5 69 (9.75%) Business Development
6 51 (7.20%) Problem-Solving
7 50 (7.06%) Decision-Making
8 49 (6.92%) B2B
9 48 (6.78%) Migration
9 48 (6.78%) Stakeholder Management
10 47 (6.64%) Roadmaps
11 46 (6.50%) Facilities Management
12 45 (6.36%) Data Migration
13 44 (6.21%) User Experience
14 42 (5.93%) Coaching
15 39 (5.51%) Data Cleansing
16 38 (5.37%) ITIL
17 36 (5.08%) Customer Service
18 35 (4.94%) Business Case
19 34 (4.80%) Project Delivery
Programming Languages
1 298 (42.09%) SQL
2 50 (7.06%) PL/SQL
3 15 (2.12%) Python
4 12 (1.69%) Java
5 10 (1.41%) C
5 10 (1.41%) Ruby
6 9 (1.27%) R
7 7 (0.99%) PowerShell
8 6 (0.85%) C#
9 3 (0.42%) Shell Script
10 2 (0.28%) JavaScript
11 1 (0.14%) Bash
11 1 (0.14%) Go
11 1 (0.14%) Scala
11 1 (0.14%) T-SQL
11 1 (0.14%) TypeScript
Qualifications
1 351 (49.58%) DBS Check
2 80 (11.30%) Degree
3 22 (3.11%) ACCA
3 22 (3.11%) Computer Science Degree
4 19 (2.68%) Security Cleared
5 12 (1.69%) PMP
6 5 (0.71%) CCNP
6 5 (0.71%) Cisco Certification
6 5 (0.71%) PMI Certification
7 4 (0.56%) Microsoft Certification
8 3 (0.42%) AAT
8 3 (0.42%) PRINCE2 Practitioner
9 2 (0.28%) CEH
9 2 (0.28%) CompTIA Security+
9 2 (0.28%) SANS
10 1 (0.14%) CISA
10 1 (0.14%) ITIL Certification
10 1 (0.14%) JNCIP
10 1 (0.14%) Master's Degree
Quality Assurance & Compliance
1 333 (47.03%) Accessibility
2 70 (9.89%) ISO 9001
3 20 (2.82%) GAAP
3 20 (2.82%) IFRS
3 20 (2.82%) QA
4 15 (2.12%) GDPR
4 15 (2.12%) ISO/IEC 27001
5 11 (1.55%) SLA
6 10 (1.41%) Cyber Essentials
7 6 (0.85%) Data Quality
8 5 (0.71%) PCI DSS
9 3 (0.42%) NIST
10 2 (0.28%) PMO
10 2 (0.28%) WCAG
11 1 (0.14%) COBIT
11 1 (0.14%) Cyber Essentials PLUS
11 1 (0.14%) Disclosure Scotland
11 1 (0.14%) HIPAA
System Software
1 18 (2.54%) Active Directory
2 11 (1.55%) VMware Infrastructure
3 8 (1.13%) Hyper-V
4 6 (0.85%) Virtual Desktop
5 4 (0.56%) vSphere
6 1 (0.14%) Docker
Systems Management
1 9 (1.27%) SCCM
2 8 (1.13%) Microsoft Intune
3 3 (0.42%) Jamf Pro
4 1 (0.14%) FortiGate
4 1 (0.14%) Kubernetes
Vendors
1 340 (48.02%) NEC
2 140 (19.77%) Microsoft
3 72 (10.17%) Citrix
4 65 (9.18%) Oracle
5 11 (1.55%) VMware
6 10 (1.41%) Cisco
7 8 (1.13%) Google
8 6 (0.85%) Meraki
8 6 (0.85%) Progress
9 5 (0.71%) Juniper
9 5 (0.71%) Zscaler
10 4 (0.56%) Extreme Networks
10 4 (0.56%) Palo Alto
10 4 (0.56%) Veeam
11 3 (0.42%) Facebook
11 3 (0.42%) HubSpot
11 3 (0.42%) Virgin Media
12 2 (0.28%) Liquidlogic
12 2 (0.28%) Workday
13 1 (0.14%) BiZZdesign