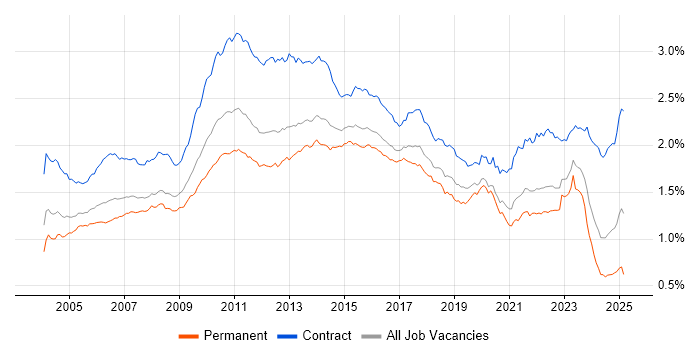
User Acceptance Testing Job Trends in England

User Acceptance Testing (UAT)
UK > England

The table below provides summary statistics and salary benchmarking for jobs advertised in England requiring User Acceptance Testing skills. It covers vacancies from the 6 months leading up to 15 September 2025, with comparisons to the same periods in the previous two years.

6 months to
15 Sep 2025
Same period 2024 Same period 2023
Rank 280 404 228
Rank change year-on-year +124 -176 +85
Permanent jobs citing User Acceptance Testing 436 395 841
As % of all permanent jobs advertised in England 1.01% 0.58% 1.52%
As % of the Processes & Methodologies category 1.14% 0.71% 1.61%
Number of salaries quoted 252 243 568
10th Percentile £38,750 £35,000 £36,250
25th Percentile £42,500 £46,250 £45,000
Median annual salary (50th Percentile) £55,000 £60,000 £57,500
Median % change year-on-year -8.33% +4.35% +12.75%
75th Percentile £72,500 £72,250 £72,000
90th Percentile £82,500 £82,400 £82,500
UK median annual salary £55,000 £60,000 £57,500
% change year-on-year -8.33% +4.35% +9.52%

All Process and Methodology Skills
England

User Acceptance Testing falls under the Processes and Methodologies category. For comparison with the information above, the following table provides summary statistics for all permanent job vacancies requiring process or methodology skills in England.

Permanent vacancies with a requirement for process or methodology skills 38,123 55,583 52,252
As % of all permanent jobs advertised in England 88.74% 81.32% 94.35%
Number of salaries quoted 21,792 32,261 39,094
10th Percentile £28,571 £32,000 £33,500
25th Percentile £37,500 £42,500 £45,000
Median annual salary (50th Percentile) £55,000 £57,500 £62,004
Median % change year-on-year -4.35% -7.26% +3.34%
75th Percentile £76,250 £77,500 £81,250
90th Percentile £97,500 £95,250 £100,000
UK median annual salary £55,000 £57,500 £60,000
% change year-on-year -4.35% -4.17% -

User Acceptance Testing
Job Vacancy Trend in England

Job postings citing User Acceptance Testing as a proportion of all IT jobs advertised in England.

Job vacancy trend for User Acceptance Testing in England

User Acceptance Testing
Salary Trend in England

Salary distribution trend for jobs in England citing User Acceptance Testing.

Salary distribution trend for jobs in England citing User Acceptance Testing

User Acceptance Testing
Salary Histogram in England

Salary distribution for jobs citing User Acceptance Testing in England over the 6 months to 15 September 2025.

Salary histogram for User Acceptance Testing in England

User Acceptance Testing
Job Locations in England

The table below looks at the demand and provides a guide to the median salaries quoted in IT jobs citing User Acceptance Testing within the England region over the 6 months to 15 September 2025. The 'Rank Change' column provides an indication of the change in demand within each location based on the same 6 month period last year.

Location Rank Change
on Same Period
Last Year
Matching
Permanent
IT Job Ads
Median Salary
Past 6 Months
Median Salary
% Change
on Same Period
Last Year
Live
Jobs
London +109 171 £65,000 -7.14% 173
South East +91 115 £47,500 -9.52% 134
Midlands +37 51 £52,500 +5.00% 31
North of England -11 39 £52,500 -12.50% 48
East of England +7 33 £53,000 +14.48% 12
West Midlands +44 28 £47,500 -13.64% 16
North West -15 25 £50,000 -16.67% 22
East Midlands +22 23 £57,500 +76.92% 15
South West +58 20 £57,500 +35.29% 15
Yorkshire +10 12 £56,250 -11.76% 20
North East +13 2 £41,000 -25.45% 12
User Acceptance Testing
UK

User Acceptance Testing
Co-occurring Skills and Capabilities in England by Category

The follow tables expand on the table above by listing co-occurrences grouped by category. The same employment type, locality and period is covered with up to 20 co-occurrences shown in each of the following categories:

Application Platforms
1 26 (5.96%) Confluence
2 8 (1.83%) Tomcat
2 8 (1.83%) WebSphere
2 8 (1.83%) WebSphere Application Server
3 7 (1.61%) SharePoint
4 2 (0.46%) Adobe Experience Manager
4 2 (0.46%) CMS
4 2 (0.46%) Drupal
4 2 (0.46%) EPiServer
4 2 (0.46%) Umbraco
5 1 (0.23%) Microsoft Exchange
5 1 (0.23%) Office Communications Server
5 1 (0.23%) Oracle Workflow
5 1 (0.23%) SharePoint 2013
Applications
1 27 (6.19%) Microsoft Excel
2 21 (4.82%) Microsoft Office
3 12 (2.75%) Microsoft PowerPoint
4 10 (2.29%) MS Visio
5 7 (1.61%) Microsoft Project
6 4 (0.92%) Spreadsheet
7 2 (0.46%) Photoshop
Business Applications
1 73 (16.74%) SAP S/4HANA
2 15 (3.44%) Dynamics CRM
3 10 (2.29%) NetSuite
4 6 (1.38%) Dynamics AX
4 6 (1.38%) Oracle Cash Management
4 6 (1.38%) Oracle Payables
4 6 (1.38%) Oracle Procure-to-Pay
4 6 (1.38%) Oracle Receivables
5 5 (1.15%) Elite 3E
5 5 (1.15%) Oracle Assets
5 5 (1.15%) Oracle General Ledger
6 4 (0.92%) Endur
6 4 (0.92%) Oracle ERP
7 3 (0.69%) iTrent
7 3 (0.69%) Oracle Financials
7 3 (0.69%) SAP PP
8 2 (0.46%) Adobe Campaign
8 2 (0.46%) Bloomberg AIM
8 2 (0.46%) Integrated Workplace Management System
8 2 (0.46%) SAP FI
Cloud Services
1 71 (16.28%) Azure
2 68 (15.60%) Power Platform
3 53 (12.16%) Azure DevOps
4 52 (11.93%) Dynamics 365
5 20 (4.59%) AWS
6 19 (4.36%) Power Automate
7 16 (3.67%) SaaS
8 7 (1.61%) OCI
8 7 (1.61%) PowerApps
9 6 (1.38%) GitHub
9 6 (1.38%) Salesforce Service Cloud
9 6 (1.38%) Serverless
9 6 (1.38%) Snowflake
10 5 (1.15%) Amazon EC2
10 5 (1.15%) Amazon S3
10 5 (1.15%) AWS CloudFormation
10 5 (1.15%) AWS Lambda
10 5 (1.15%) Azure Data Factory
10 5 (1.15%) IaaS
10 5 (1.15%) SuccessFactors
Communications & Networking
1 8 (1.83%) SSL
2 6 (1.38%) VoIP
3 5 (1.15%) DMZ
3 5 (1.15%) STUN
3 5 (1.15%) VLAN
3 5 (1.15%) VPN
4 4 (0.92%) Firewall
5 3 (0.69%) Network Security
6 1 (0.23%) RFID
6 1 (0.23%) SAN
Database & Business Intelligence
1 25 (5.73%) Power BI
2 21 (4.82%) SQL Server
3 10 (2.29%) Oracle Reports
3 10 (2.29%) PostgreSQL
3 10 (2.29%) Relational Database
4 9 (2.06%) Data Warehouse
5 8 (1.83%) DB2
5 8 (1.83%) Metadata
6 6 (1.38%) Tableau
7 5 (1.15%) Amazon RDS
7 5 (1.15%) Oracle Database
8 4 (0.92%) Data Mining
8 4 (0.92%) KDB
8 4 (0.92%) Kdb+
9 3 (0.69%) MySQL
10 2 (0.46%) BusinessObjects
10 2 (0.46%) Electronic Patient Records
10 2 (0.46%) GIS
10 2 (0.46%) SQL Server Integration Services
10 2 (0.46%) SQL Server Reporting Services
Development Applications
1 70 (16.06%) JIRA
2 17 (3.90%) Selenium
3 4 (0.92%) Cypress.io
3 4 (0.92%) Git
3 4 (0.92%) Postman
4 3 (0.69%) eCATT
4 3 (0.69%) Jenkins
4 3 (0.69%) Team Foundation Server
5 2 (0.46%) Grunt
5 2 (0.46%) gulp
5 2 (0.46%) JMeter
5 2 (0.46%) Oracle Forms
5 2 (0.46%) webpack
6 1 (0.23%) Gatling
6 1 (0.23%) GitLab
6 1 (0.23%) JUnit
6 1 (0.23%) Katalon Studio
6 1 (0.23%) Locust
6 1 (0.23%) TestRail
6 1 (0.23%) Zephyr
General
1 241 (55.28%) Finance
2 219 (50.23%) Social Skills
3 87 (19.95%) Marketing
4 82 (18.81%) Analytical Skills
5 73 (16.74%) Manufacturing
6 42 (9.63%) Law
6 42 (9.63%) Legal
7 36 (8.26%) Inclusion and Diversity
8 30 (6.88%) Banking
9 29 (6.65%) Retail
10 28 (6.42%) Presentation Skills
11 17 (3.90%) Influencing Skills
12 16 (3.67%) Documentation Skills
13 15 (3.44%) Organisational Skills
14 12 (2.75%) Back Office
15 11 (2.52%) Public Sector
16 10 (2.29%) Financial Institution
17 8 (1.83%) General Ledger
18 6 (1.38%) Front Office
19 5 (1.15%) Investment Banking
Job Titles
1 188 (43.12%) Analyst
2 97 (22.25%) Senior
3 68 (15.60%) Senior Analyst
4 64 (14.68%) Business Analyst
5 58 (13.30%) SAP Analyst
6 38 (8.72%) Consultant
6 38 (8.72%) Lead
7 34 (7.80%) Developer
8 27 (6.19%) Functional Consultant
9 24 (5.50%) Dynamics 365 Consultant
10 23 (5.28%) Applications Support
11 22 (5.05%) Test Manager
12 21 (4.82%) Systems Analyst
13 18 (4.13%) Test Analyst
14 16 (3.67%) Automation Developer
15 15 (3.44%) Product Owner
16 14 (3.21%) Project Manager
17 13 (2.98%) Robotic Process Automation Developer
18 12 (2.75%) Support Analyst
18 12 (2.75%) Test Engineer
Libraries, Frameworks & Software Standards
1 13 (2.98%) .NET
2 9 (2.06%) EDI
2 9 (2.06%) HTML
2 9 (2.06%) Oracle Fusion
3 8 (1.83%) ADO
3 8 (1.83%) CSS
3 8 (1.83%) LAPP Stack
3 8 (1.83%) LDAP
3 8 (1.83%) WebSphere MQ
4 7 (1.61%) Playwright
4 7 (1.61%) XML
5 6 (1.38%) JSON
6 5 (1.15%) FreeSWITCH
7 4 (0.92%) Middleware
7 4 (0.92%) React
7 4 (0.92%) RESTful
8 3 (0.69%) Blazor
8 3 (0.69%) Web Services
9 2 (0.46%) EDIFACT
9 2 (0.46%) SOAP
Miscellaneous
1 30 (6.88%) Management Information System
2 28 (6.42%) Greenfield Project
3 24 (5.50%) Product Ownership
4 14 (3.21%) Self-Motivation
5 13 (2.98%) Onboarding
6 9 (2.06%) Driving Licence
6 9 (2.06%) Reinsurance
7 8 (1.83%) Foreign Exchange (FX)
7 8 (1.83%) Linux Command Line
8 7 (1.61%) Analytical Mindset
9 6 (1.38%) Derivative
9 6 (1.38%) Team-Oriented Environment
10 5 (1.15%) NHS
11 4 (0.92%) Algorithms
11 4 (0.92%) Data Protection Act
11 4 (0.92%) FMCG
11 4 (0.92%) Public Cloud
11 4 (0.92%) Reference Data
12 3 (0.69%) Data Centre
12 3 (0.69%) Life Science
Operating Systems
1 33 (7.57%) Windows
2 21 (4.82%) Linux
3 9 (2.06%) Unix
4 8 (1.83%) Red Hat Enterprise Linux
5 6 (1.38%) Windows Server
6 5 (1.15%) Debian
6 5 (1.15%) Mac OS
Processes & Methodologies
1 188 (43.12%) Agile
2 138 (31.65%) Problem-Solving
3 75 (17.20%) Translating Business Requirements
4 74 (16.97%) DevOps
5 73 (16.74%) Stakeholder Management
6 70 (16.06%) Data Management
7 67 (15.37%) Project Management
8 66 (15.14%) ERP
9 65 (14.91%) Migration
10 62 (14.22%) Logistics
11 61 (13.99%) Continuous Improvement
12 56 (12.84%) Business Analysis
12 56 (12.84%) Data Collection
12 56 (12.84%) Impact Analysis
12 56 (12.84%) Incident Management
13 55 (12.61%) Requirements Gathering
13 55 (12.61%) Roadmaps
14 53 (12.16%) Architectural Design
14 53 (12.16%) Test Automation
14 53 (12.16%) User Stories
Programming Languages
1 83 (19.04%) SQL
2 32 (7.34%) Python
3 14 (3.21%) C#
3 14 (3.21%) JavaScript
4 8 (1.83%) T-SQL
5 6 (1.38%) Java
5 6 (1.38%) X++
6 5 (1.15%) Data Analysis Expressions
7 4 (0.92%) C
7 4 (0.92%) C++
8 2 (0.46%) PHP
8 2 (0.46%) PowerShell
9 1 (0.23%) Apex Code
9 1 (0.23%) R
9 1 (0.23%) TypeScript
9 1 (0.23%) VBA
Qualifications
1 69 (15.83%) Degree
2 33 (7.57%) ISTQB
3 22 (5.05%) Computer Science Degree
4 10 (2.29%) ISTQB Foundation Certification
5 9 (2.06%) AWS Certification
5 9 (2.06%) ITIL Certification
6 8 (1.83%) ISEB
7 7 (1.61%) SC Cleared
7 7 (1.61%) Security Cleared
8 6 (1.38%) ACCA
8 6 (1.38%) CIMA
8 6 (1.38%) DBS Check
9 5 (1.15%) Microsoft Certification
10 4 (0.92%) BPSS Clearance
10 4 (0.92%) CBAP
10 4 (0.92%) GISP
11 3 (0.69%) ITIL Foundation Certificate
12 2 (0.46%) Azure Certification
12 2 (0.46%) CFA
12 2 (0.46%) CITP
Quality Assurance & Compliance
1 72 (16.51%) QA
2 20 (4.59%) SLA
3 19 (4.36%) Data Quality
4 15 (3.44%) GDPR
5 6 (1.38%) PMO
5 6 (1.38%) Sarbanes-Oxley
6 5 (1.15%) Cyber Essentials
6 5 (1.15%) ISO 9001
6 5 (1.15%) ISO/IEC 27001
7 4 (0.92%) Accessibility
8 3 (0.69%) 21 CFR Part 11
8 3 (0.69%) Good Clinical Practice
8 3 (0.69%) MiFID
9 2 (0.46%) EMIR
9 2 (0.46%) GRC
9 2 (0.46%) ISO 20022
9 2 (0.46%) SEPA
9 2 (0.46%) UCITS
10 1 (0.23%) PCI DSS
System Software
1 5 (1.15%) Kamailio
2 3 (0.69%) Docker
Systems Management
1 7 (1.61%) Kubernetes
2 6 (1.38%) Terraform
3 2 (0.46%) Grafana
3 2 (0.46%) Prometheus
3 2 (0.46%) Systems Management Server (SMS)
4 1 (0.23%) Ansible
4 1 (0.23%) HP Quality Center
4 1 (0.23%) Progress Chef
4 1 (0.23%) Puppet
Vendors
1 105 (24.08%) Microsoft
2 88 (20.18%) SAP
3 32 (7.34%) Oracle
4 28 (6.42%) Salesforce
5 22 (5.05%) Blue Prism
6 16 (3.67%) ServiceNow
7 10 (2.29%) IBM
8 8 (1.83%) Red Hat
9 5 (1.15%) Bloomberg
9 5 (1.15%) Databricks
9 5 (1.15%) iManage
10 4 (0.92%) Sitecore
11 3 (0.69%) Adobe
11 3 (0.69%) Alteryx
11 3 (0.69%) Google
11 3 (0.69%) OpenLink
12 2 (0.46%) FFastFill
12 2 (0.46%) JD Edwards
12 2 (0.46%) Pega
12 2 (0.46%) Splunk