Senior Jobs in London

Senior
England > London

The median Senior salary in London is £80,000 per year, according to job vacancies posted during the 6 months leading to 9 July 2025.

The table below provides salary benchmarking and summary statistics, comparing them to the same period in the previous two years.

6 months to
9 Jul 2025
Same period 2024 Same period 2023
Rank 9 5 7
Rank change year-on-year -4 +2 -1
Permanent jobs requiring a Senior 2,386 4,491 5,149
As % of all permanent jobs advertised in London 18.01% 18.83% 17.31%
As % of the Job Titles category 19.66% 19.95% 18.28%
Number of salaries quoted 1,355 3,045 4,031
10th Percentile £55,500 £50,000 £53,750
25th Percentile £64,300 £62,500 £65,000
Median annual salary (50th Percentile) £80,000 £77,500 £82,500
Median % change year-on-year +3.23% -6.06% +6.45%
75th Percentile £102,500 £95,000 £100,000
90th Percentile £120,000 £119,500 £116,250
England median annual salary £65,000 £62,783 £70,000
% change year-on-year +3.53% -10.31% -

All Permanent IT Job Vacancies
London

For comparison with the information above, the following table provides summary statistics for all permanent IT job vacancies in London. Most job vacancies include a discernible job title that can be normalized. As such, the figures in the second row provide an indication of the number of permanent jobs in our overall sample.

Permanent vacancies in London with a recognized job title 12,136 22,516 28,169
% of permanent jobs with a recognized job title 91.59% 94.39% 94.70%
Number of salaries quoted 7,426 16,449 22,023
10th Percentile £40,000 £37,500 £41,250
25th Percentile £54,538 £50,000 £53,750
Median annual salary (50th Percentile) £73,159 £70,000 £72,500
Median % change year-on-year +4.51% -3.45% +3.57%
75th Percentile £97,500 £93,750 £95,000
90th Percentile £120,000 £115,000 £115,000
England median annual salary £55,000 £52,500 £60,000
% change year-on-year +4.76% -12.50% -

Senior
Job Vacancy Trend in London

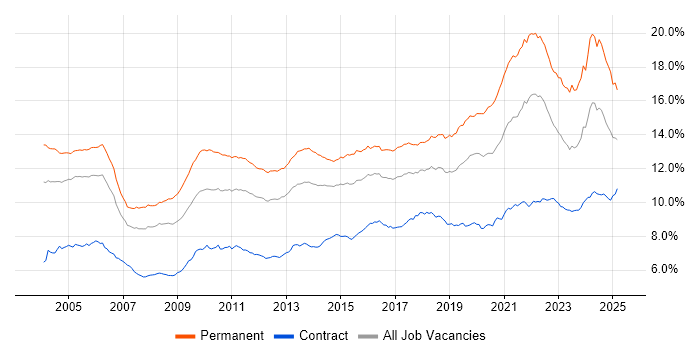
Job postings that featured Senior in the job title as a proportion of all IT jobs advertised in London.

Job vacancy trend for Senior in London

Senior
Salary Trend in London

3-month moving average salary quoted in jobs citing Senior in London.

Salary trend for Senior in London

Senior
Salary Histogram in London

Salary distribution for jobs citing Senior in London over the 6 months to 9 July 2025.

Salary histogram for Senior in London

Senior
Job Locations in London

The table below looks at the demand and provides a guide to the median salaries quoted in IT jobs citing Senior within the London region over the 6 months to 9 July 2025. The 'Rank Change' column provides an indication of the change in demand within each location based on the same 6 month period last year.

Location Rank Change
on Same Period
Last Year
Matching
Permanent
IT Job Ads
Median Salary
Past 6 Months
Median Salary
% Change
on Same Period
Last Year
Live
Jobs
Central London -4 447 £80,000 - 318
South London 0 90 £107,500 +65.38% 17
West London -10 68 £62,500 +8.70% 54
East London +6 42 £80,000 +39.13% 30
North London -7 23 £75,000 +7.14% 10
Senior
England

Senior Skill Set
Top 30 Co-occurring Skills and Capabilities in London

For the 6 months to 9 July 2025, Senior job roles required the following skills and capabilities in order of popularity. The figures indicate the absolute number co-occurrences and as a proportion of all permanent job ads across the London region featuring Senior in the job title.

1 910 (38.14%) Finance
2 833 (34.91%) Agile
3 687 (28.79%) Python
4 686 (28.75%) AWS
5 605 (25.36%) Azure
6 604 (25.31%) Social Skills
7 547 (22.93%) Problem-Solving
8 445 (18.65%) Degree
9 442 (18.52%) Software Engineering
10 419 (17.56%) CI/CD
11 388 (16.26%) Artificial Intelligence
12 383 (16.05%) Mentoring
13 371 (15.55%) SQL
14 360 (15.09%) Analytical Skills
15 352 (14.75%) TypeScript
16 345 (14.46%) Banking
17 295 (12.36%) Analytics
18 287 (12.03%) Microsoft
19 283 (11.86%) Java
20 264 (11.06%) DevOps
21 261 (10.94%) Law
22 259 (10.85%) Inclusion and Diversity
23 258 (10.81%) GCP
24 257 (10.77%) JavaScript
25 234 (9.81%) Kubernetes
25 234 (9.81%) React
26 208 (8.72%) Machine Learning
27 204 (8.55%) Computer Science
27 204 (8.55%) Roadmaps
28 197 (8.26%) Broadband

Senior Skill Set
Co-occurring Skills and Capabilities in London by Category

The follow tables expand on the table above by listing co-occurrences grouped by category. The same employment type, locality and period is covered with up to 20 co-occurrences shown in each of the following categories:

Application Platforms
1 105 (4.40%) Apache Airflow
2 86 (3.60%) Apache
3 62 (2.60%) SharePoint
4 52 (2.18%) Microsoft Exchange
5 48 (2.01%) Apache Spark
6 22 (0.92%) Confluence
7 20 (0.84%) CMS
8 11 (0.46%) WordPress
9 8 (0.34%) Headless CMS
10 5 (0.21%) Liferay
10 5 (0.21%) Luigi
10 5 (0.21%) nginx
11 4 (0.17%) Drupal
11 4 (0.17%) Jupyter
11 4 (0.17%) Skype for Business
12 3 (0.13%) SAS
13 2 (0.084%) Adobe Experience Manager
14 1 (0.042%) Ethereum
14 1 (0.042%) NServiceBus
14 1 (0.042%) OpenStack
Applications
1 56 (2.35%) Microsoft Excel
2 39 (1.63%) Microsoft Office
3 28 (1.17%) Microsoft PowerPoint
4 21 (0.88%) Maya
5 20 (0.84%) MS Visio
6 15 (0.63%) Chatbot
7 6 (0.25%) Microsoft Project
7 6 (0.25%) Sketch
8 5 (0.21%) Adobe XD
9 4 (0.17%) Adobe Creative Suite
9 4 (0.17%) Spreadsheet
10 3 (0.13%) UserZoom
11 1 (0.042%) Stata
11 1 (0.042%) Trello
Business Applications
1 35 (1.47%) Dynamics CRM
1 35 (1.47%) SAP S/4HANA
2 18 (0.75%) SAP IBP
3 11 (0.46%) Shopify
4 10 (0.42%) SAP CO
4 10 (0.42%) SAP FI
4 10 (0.42%) SAP FI/CO
5 9 (0.38%) Dynamics AX
5 9 (0.38%) Salesforce CRM
6 8 (0.34%) NetSuite
7 7 (0.29%) SAP FSCM
8 5 (0.21%) Aladdin
8 5 (0.21%) Remedy ITSM
8 5 (0.21%) SAP IS-U
8 5 (0.21%) SAP MM
9 4 (0.17%) Endur
9 4 (0.17%) Oracle EBS
9 4 (0.17%) SimCorp Dimension
10 3 (0.13%) Payment Gateway
10 3 (0.13%) SAP SCM
Cloud Services
1 686 (28.75%) AWS
2 605 (25.36%) Azure
3 258 (10.81%) GCP
4 193 (8.09%) Serverless
5 157 (6.58%) AWS Lambda
6 129 (5.41%) Power Platform
7 123 (5.16%) Snowflake
8 105 (4.40%) Microsoft 365
9 102 (4.27%) SaaS
10 87 (3.65%) dbt
11 84 (3.52%) Amazon S3
12 57 (2.39%) Dynamics 365
13 54 (2.26%) Amazon EC2
14 48 (2.01%) Azure DevOps
15 46 (1.93%) Amazon EKS
16 39 (1.63%) GitHub
17 38 (1.59%) Cloud Computing
17 38 (1.59%) Entra ID
18 36 (1.51%) AWS CloudFormation
19 35 (1.47%) Amazon ECS
Communications & Networking
1 197 (8.26%) Broadband
2 75 (3.14%) Firewall
3 59 (2.47%) Network Security
4 47 (1.97%) VPN
5 32 (1.34%) DNS
6 30 (1.26%) WAN
7 28 (1.17%) LAN
8 22 (0.92%) TCP/IP
9 20 (0.84%) Wi-Fi
10 18 (0.75%) HTTP
11 17 (0.71%) Multicast
12 14 (0.59%) BGP
13 11 (0.46%) DHCP
13 11 (0.46%) Wireless
13 11 (0.46%) Wireshark
14 10 (0.42%) Cisco Nexus
14 10 (0.42%) OSPF
14 10 (0.42%) SD-WAN
15 9 (0.38%) WLAN
16 8 (0.34%) VoIP
Database & Business Intelligence
1 106 (4.44%) Data Lake
2 92 (3.86%) Power BI
3 85 (3.56%) NoSQL
4 83 (3.48%) Data Warehouse
4 83 (3.48%) SQL Server
5 80 (3.35%) Amazon Athena
6 70 (2.93%) Apache Arrow
6 70 (2.93%) Apache Iceberg
6 70 (2.93%) Apache Ignite
6 70 (2.93%) Dremio
6 70 (2.93%) PostgreSQL
7 59 (2.47%) DynamoDB
8 52 (2.18%) Relational Database
8 52 (2.18%) Tableau
9 51 (2.14%) Elasticsearch
10 38 (1.59%) Big Data
11 32 (1.34%) MySQL
12 30 (1.26%) MongoDB
13 29 (1.22%) SQL Server Integration Services
13 29 (1.22%) SQL Server Reporting Services
Development Applications
1 109 (4.57%) Git
2 75 (3.14%) JIRA
3 54 (2.26%) Jenkins
4 23 (0.96%) GitLab
5 20 (0.84%) IntelliJ
6 19 (0.80%) JUnit
7 16 (0.67%) Cypress.io
8 15 (0.63%) Maven
9 14 (0.59%) Cucumber
9 14 (0.59%) Mockito
10 13 (0.54%) Visual Studio
11 11 (0.46%) Bitbucket
12 9 (0.38%) Selenium
13 8 (0.34%) Vite
14 6 (0.25%) CircleCI
14 6 (0.25%) SpecFlow
15 5 (0.21%) Eclipse
16 4 (0.17%) Atlassian Bamboo
16 4 (0.17%) Moq
16 4 (0.17%) Sonatype Nexus
General
1 910 (38.14%) Finance
2 604 (25.31%) Social Skills
3 360 (15.09%) Analytical Skills
4 345 (14.46%) Banking
5 261 (10.94%) Law
6 259 (10.85%) Inclusion and Diversity
7 188 (7.88%) Marketing
8 173 (7.25%) Games
9 140 (5.87%) Front Office
10 107 (4.48%) Presentation Skills
11 98 (4.11%) Investment Banking
12 94 (3.94%) Retail
13 84 (3.52%) Public Sector
14 83 (3.48%) Legal
15 79 (3.31%) Telecoms
16 53 (2.22%) Advertising
17 45 (1.89%) Influencing Skills
18 43 (1.80%) Manufacturing
19 42 (1.76%) Financial Institution
20 36 (1.51%) Back Office
Libraries, Frameworks & Software Standards
1 234 (9.81%) React
2 149 (6.24%) GraphQL
3 144 (6.04%) .NET
4 101 (4.23%) REST
5 98 (4.11%) HTML
6 97 (4.07%) Kafka
7 91 (3.81%) Pandas
8 86 (3.60%) CSS
9 82 (3.44%) RESTful
10 81 (3.39%) AngularJS
11 78 (3.27%) gRPC
12 74 (3.10%) NumPy
12 74 (3.10%) SciPy
13 73 (3.06%) Protocol Buffers
14 67 (2.81%) Unity (Game Engine)
14 67 (2.81%) WebGL
15 62 (2.60%) Node.js
16 56 (2.35%) Spring
17 53 (2.22%) PySpark
18 45 (1.89%) Next.js
Miscellaneous
1 138 (5.78%) Cloud Native
2 123 (5.16%) Equities
3 120 (5.03%) Derivative
4 117 (4.90%) Management Information System
5 105 (4.40%) Hedge funds
6 104 (4.36%) Product Ownership
7 94 (3.94%) Foreign Exchange (FX)
8 90 (3.77%) Self-Motivation
9 87 (3.65%) Fixed Income
10 80 (3.35%) Algorithms
11 69 (2.89%) Distributed Systems
12 67 (2.81%) Animation
13 65 (2.72%) Pricing Data
14 61 (2.56%) Enterprise Software
15 48 (2.01%) Onboarding
16 46 (1.93%) Data Structures
17 39 (1.63%) Mobile App
18 36 (1.51%) Data Centre
19 33 (1.38%) Hybrid Cloud
20 32 (1.34%) Greenfield Project
Operating Systems
1 158 (6.62%) Linux
2 137 (5.74%) Windows
3 39 (1.63%) Windows Server
4 38 (1.59%) Unix
5 33 (1.38%) Apple iOS
6 31 (1.30%) Windows 10
7 27 (1.13%) Android
8 15 (0.63%) Red Hat Enterprise Linux
9 6 (0.25%) VMS
10 5 (0.21%) CentOS
10 5 (0.21%) HPUX
10 5 (0.21%) Oracle Linux
10 5 (0.21%) Solaris
11 4 (0.17%) Windows Server 2012
12 3 (0.13%) Mac OS
12 3 (0.13%) Windows Server 2016
13 2 (0.084%) zOS
14 1 (0.042%) Amazon Linux
14 1 (0.042%) Embedded Linux
14 1 (0.042%) Windows Server 2019
Processes & Methodologies
1 833 (34.91%) Agile
2 547 (22.93%) Problem-Solving
3 442 (18.52%) Software Engineering
4 419 (17.56%) CI/CD
5 388 (16.26%) Artificial Intelligence
6 383 (16.05%) Mentoring
7 295 (12.36%) Analytics
8 264 (11.06%) DevOps
9 208 (8.72%) Machine Learning
10 204 (8.55%) Computer Science
10 204 (8.55%) Roadmaps
11 195 (8.17%) User Experience
12 187 (7.84%) Data Science
13 169 (7.08%) Continuous Improvement
14 164 (6.87%) Microservices
15 162 (6.79%) Project Management
16 159 (6.66%) Stakeholder Management
17 148 (6.20%) Asset Management
17 148 (6.20%) Decision-Making
18 146 (6.12%) Clean Code
Programming Languages
1 687 (28.79%) Python
2 371 (15.55%) SQL
3 352 (14.75%) TypeScript
4 283 (11.86%) Java
5 257 (10.77%) JavaScript
6 165 (6.92%) C#
7 107 (4.48%) C++
8 67 (2.81%) HLSL
9 57 (2.39%) PowerShell
10 54 (2.26%) Rust
11 51 (2.14%) Go
12 37 (1.55%) T-SQL
13 32 (1.34%) Bash
14 31 (1.30%) C
14 31 (1.30%) Scala
15 25 (1.05%) PHP
16 23 (0.96%) Kotlin
17 22 (0.92%) Shell Script
18 17 (0.71%) Bicep
19 16 (0.67%) R
Qualifications
1 445 (18.65%) Degree
2 108 (4.53%) Computer Science Degree
3 90 (3.77%) PhD
4 65 (2.72%) Master's Degree
4 65 (2.72%) Security Cleared
5 60 (2.51%) AWS Certification
6 46 (1.93%) Cisco Certification
7 45 (1.89%) CISA
8 42 (1.76%) SC Cleared
9 30 (1.26%) Azure Certification
10 29 (1.22%) DBS Check
11 28 (1.17%) CISSP
12 27 (1.13%) CCNP
13 23 (0.96%) PMI Certification
14 22 (0.92%) ACCA
14 22 (0.92%) CIMA
15 20 (0.84%) MRICS
16 19 (0.80%) ICAEW
17 18 (0.75%) CCNA
18 16 (0.67%) Microsoft Certification
Quality Assurance & Compliance
1 118 (4.95%) QA
2 58 (2.43%) Accessibility
3 38 (1.59%) GDPR
4 35 (1.47%) Data Quality
5 27 (1.13%) ITGC
6 25 (1.05%) ISO/IEC 27001
7 20 (0.84%) NIST
7 20 (0.84%) PMO
8 17 (0.71%) SLA
9 10 (0.42%) Sarbanes-Oxley
9 10 (0.42%) WCAG
10 7 (0.29%) IFRS
11 6 (0.25%) GAAP
11 6 (0.25%) GRC
11 6 (0.25%) HIPAA
11 6 (0.25%) MiFID
11 6 (0.25%) PCI DSS
12 5 (0.21%) Cyber Essentials
12 5 (0.21%) SOC 2
12 5 (0.21%) Software Quality Assurance
System Software
1 156 (6.54%) Docker
2 82 (3.44%) Active Directory
3 35 (1.47%) VMware Infrastructure
4 16 (0.67%) Virtual Desktop
5 9 (0.38%) Hyper-V
5 9 (0.38%) Virtual Machines
6 5 (0.21%) Apache Flume
6 5 (0.21%) VMware ESXi
7 4 (0.17%) Firmware
7 4 (0.17%) Veritas Cluster Server
8 2 (0.084%) BitLocker
8 2 (0.084%) XenDesktop
9 1 (0.042%) vSphere
9 1 (0.042%) XenApp
Systems Management
1 234 (9.81%) Kubernetes
2 191 (8.01%) Terraform
3 69 (2.89%) Ansible
4 55 (2.31%) Microsoft Intune
5 33 (1.38%) Grafana
6 26 (1.09%) Single Sign-On
7 23 (0.96%) Prometheus
8 10 (0.42%) Nagios
9 9 (0.38%) Progress Chef
9 9 (0.38%) SCCM
10 8 (0.34%) Argo
10 8 (0.34%) Failover Clustering
10 8 (0.34%) Istio
10 8 (0.34%) ITRS Geneos
11 6 (0.25%) FortiGate
11 6 (0.25%) Puppet
12 5 (0.21%) Avamar
12 5 (0.21%) Oozie
13 4 (0.17%) Matomo
14 3 (0.13%) CASB
Vendors
1 287 (12.03%) Microsoft
2 111 (4.65%) ServiceNow
3 109 (4.57%) Google
4 87 (3.65%) SAP
5 83 (3.48%) Databricks
6 82 (3.44%) Oracle
7 78 (3.27%) Cisco
8 61 (2.56%) Salesforce
9 59 (2.47%) VMware
10 36 (1.51%) Meraki
11 34 (1.42%) IBM
12 31 (1.30%) Adobe
13 28 (1.17%) Apple
14 27 (1.13%) Red Hat
15 22 (0.92%) Splunk
16 19 (0.80%) Dell
16 19 (0.80%) SolarWinds
17 18 (0.75%) Fortinet
18 17 (0.71%) MuleSoft
18 17 (0.71%) Workday