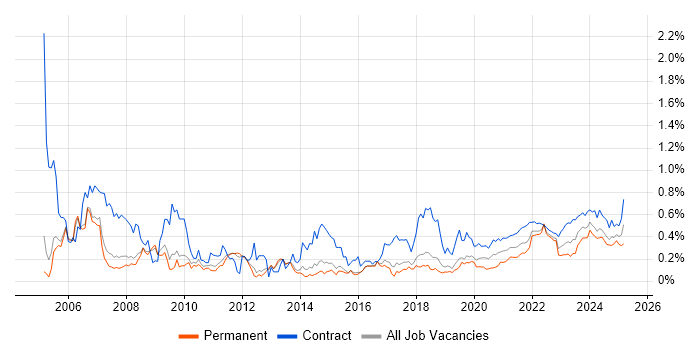
Hybrid/Remote Coordinator Job Trends

Coordinator
UK > Work from Home

The median Coordinator salary for remote/hybrid work is £30,000 per year, according to job vacancies posted during the 6 months leading to 22 November 2025.

The table below compares current salary benchmarking and summary statistics with the previous two years.

6 months to
22 Nov 2025
Same period 2024 Same period 2023
Rank 238 412 430
Rank change year-on-year +174 +18 +34
Permanent jobs requiring a Coordinator 137 60 61
As % of all permanent jobs with remote/hybrid work options 0.90% 0.30% 0.28%
As % of the Job Titles category 0.96% 0.31% 0.30%
Number of salaries quoted 74 30 47
10th Percentile £24,500 £26,250 £25,650
25th Percentile £26,250 £26,688 £28,750
Median annual salary (50th Percentile) £30,000 £28,417 £35,000
Median % change year-on-year +5.57% -18.81% -
75th Percentile £34,406 £33,375 £40,000
90th Percentile £48,750 £38,125 £60,250
UK median annual salary £30,000 £32,000 £35,000
% change year-on-year -6.25% -8.57% +2.94%

All Permanent IT Job Vacancies
Work from Home

For comparison with the information above, the following table provides summary statistics for all permanent IT job vacancies with remote/hybrid work options. Most job vacancies include a discernible job title that can be normalized. As such, the figures in the second row provide an indication of the number of permanent jobs in our overall sample.

Permanent vacancies in Work from Home with a recognized job title 14,331 19,479 20,593
% of permanent jobs with a recognized job title 93.71% 96.55% 95.92%
Number of salaries quoted 9,156 12,285 16,842
10th Percentile £29,750 £35,000 £36,250
25th Percentile £40,000 £45,000 £46,250
Median annual salary (50th Percentile) £57,000 £60,000 £61,000
Median % change year-on-year -5.00% -1.64% -2.40%
75th Percentile £77,500 £80,000 £80,000
90th Percentile £95,000 £97,500 £97,500
UK median annual salary £53,500 £57,500 £60,000
% change year-on-year -6.96% -4.17% -

Coordinator
Job Vacancy Trend for Remote/Hybrid Roles

Historical trend showing the proportion of permanent IT job postings featuring 'Coordinator' in the job title and offering remote or hybrid work options relative to all permanent IT jobs advertised.

Coordinator job vacancy trend for remote/hybrid roles

Coordinator
Salary Trend for Remote/Hybrid Jobs

Salary distribution trend for remote Coordinator job vacancies.

Salary distribution trend for remote Coordinator job vacancies

Coordinator
Salary Histogram for Remote/Hybrid Jobs

Salary distribution for jobs with remote/hybrid work options citing Coordinator over the 6 months to 22 November 2025.

Coordinator salary histogram for jobs with remote/hybrid work options

Coordinator Skill Set
Top 30 Co-Occurring Skills & Capabilities in Remote/Hybrid Jobs

For the 6 months to 22 November 2025, Coordinator job roles required the following skills and capabilities in order of popularity. The figures indicate the absolute number of co-occurrences and as a proportion of all permanent jobs with hybrid/remote work options featuring Coordinator in the job title.

1 38 (27.74%) Degree
2 23 (16.79%) Customer Service
3 21 (15.33%) Project Management
4 20 (14.60%) AI
4 20 (14.60%) Chatbot
4 20 (14.60%) Conversational UI
4 20 (14.60%) PayPal
5 16 (11.68%) Microsoft
6 14 (10.22%) CRM
6 14 (10.22%) Project Delivery
7 11 (8.03%) PMO
7 11 (8.03%) Problem-Solving
8 10 (7.30%) Agile
8 10 (7.30%) Decision-Making
8 10 (7.30%) Logistics
8 10 (7.30%) PRINCE2
9 9 (6.57%) SaaS
10 8 (5.84%) Collaborative Working
10 8 (5.84%) Microsoft Office
10 8 (5.84%) Task Automation
10 8 (5.84%) WordPress
11 7 (5.11%) Change Management
11 7 (5.11%) Continuous Improvement
11 7 (5.11%) Cybersecurity
11 7 (5.11%) Data Analysis
11 7 (5.11%) Global Marketing
11 7 (5.11%) Google
11 7 (5.11%) Process Improvement
11 7 (5.11%) Risk Management
11 7 (5.11%) Time Management

Coordinator Skill Set
Co-Occurring Skills & Capabilities in Remote/Hybrid Jobs by Category

The following tables expand on the one above by listing co-occurrences grouped by category. They cover the same employment type, locality and period, with up to 20 co-occurrences shown in each category:

Application Platforms
1 8 (5.84%) WordPress
2 3 (2.19%) SharePoint
3 2 (1.46%) CMS
Applications
1 20 (14.60%) Chatbot
2 8 (5.84%) Microsoft Office
3 6 (4.38%) AutoCAD
3 6 (4.38%) Microsoft Excel
3 6 (4.38%) Revit
4 5 (3.65%) 3ds Max
4 5 (3.65%) Navisworks
4 5 (3.65%) SketchUp
5 4 (2.92%) Photoshop
6 3 (2.19%) Adobe Creative Suite
7 2 (1.46%) Microsoft PowerPoint
7 2 (1.46%) Microsoft Project
7 2 (1.46%) MS Visio
8 1 (0.73%) Spreadsheet
Business Applications
1 1 (0.73%) Elite 3E
1 1 (0.73%) Raiser’s Edge
Cloud Services
1 9 (6.57%) SaaS
2 6 (4.38%) Microsoft 365
3 5 (3.65%) Azure
3 5 (3.65%) Google Ads
4 4 (2.92%) Amazon Ads
5 3 (2.19%) Azure DevOps
5 3 (2.19%) Canva
5 3 (2.19%) GitHub
6 2 (1.46%) Asana
6 2 (1.46%) Entra ID
6 2 (1.46%) Facebook Ads
6 2 (1.46%) Google Analytics
7 1 (0.73%) Google Docs
7 1 (0.73%) Google Sheets
7 1 (0.73%) OneDrive
Communications & Networking
1 4 (2.92%) Internet
2 3 (2.19%) Wireless
3 1 (0.73%) WebEx
Development Applications
1 1 (0.73%) JIRA
General
1 49 (35.77%) Social Skills
2 27 (19.71%) Marketing
3 14 (10.22%) Advertising
4 13 (9.49%) Analytical Skills
5 10 (7.30%) Legal
5 10 (7.30%) Presentation Skills
6 8 (5.84%) Inclusion and Diversity
6 8 (5.84%) Organisational Skills
7 7 (5.11%) Finance
8 6 (4.38%) Manufacturing
9 5 (3.65%) Retail
10 4 (2.92%) Back Office
10 4 (2.92%) Billing
10 4 (2.92%) Law
10 4 (2.92%) Telecoms
11 3 (2.19%) Aerospace
11 3 (2.19%) Aviation
11 3 (2.19%) Electronics
12 2 (1.46%) Automotive
12 2 (1.46%) Public Sector
Libraries, Frameworks & Software Standards
1 2 (1.46%) EDI
Miscellaneous
1 14 (10.22%) Social Media
2 11 (8.03%) Onboarding
3 10 (7.30%) Management Information System
4 8 (5.84%) Blog
5 7 (5.11%) Self-Motivation
6 6 (4.38%) e-Learning
7 5 (3.65%) Digital Media
7 5 (3.65%) Learning Management System
8 4 (2.92%) Driving Licence
9 3 (2.19%) Video Conferencing
10 2 (1.46%) Housing Association
10 2 (1.46%) Mobile App
10 2 (1.46%) Virtual Team
11 1 (0.73%) Animation
11 1 (0.73%) Cyber Threat
11 1 (0.73%) Web Conferencing
Operating Systems
1 4 (2.92%) Windows
2 1 (0.73%) Mac OS
Processes & Methodologies
1 23 (16.79%) Customer Service
2 21 (15.33%) Project Management
3 20 (14.60%) AI
3 20 (14.60%) Conversational UI
4 14 (10.22%) CRM
4 14 (10.22%) Project Delivery
5 11 (8.03%) Problem-Solving
6 10 (7.30%) Agile
6 10 (7.30%) Decision-Making
6 10 (7.30%) Logistics
6 10 (7.30%) PRINCE2
7 8 (5.84%) Collaborative Working
7 8 (5.84%) Task Automation
8 7 (5.11%) Change Management
8 7 (5.11%) Continuous Improvement
8 7 (5.11%) Cybersecurity
8 7 (5.11%) Data Analysis
8 7 (5.11%) Global Marketing
8 7 (5.11%) Process Improvement
8 7 (5.11%) Time Management
Programming Languages
1 1 (0.73%) R
Qualifications
1 38 (27.74%) Degree
2 6 (4.38%) DBS Check
2 6 (4.38%) SC Cleared
2 6 (4.38%) Security Cleared
3 5 (3.65%) RIBA
4 2 (1.46%) City & Guilds
5 1 (0.73%) CISM
5 1 (0.73%) CISSP
5 1 (0.73%) CRISC
5 1 (0.73%) ITIL Foundation Certificate
5 1 (0.73%) PMI Certification
5 1 (0.73%) PMP
5 1 (0.73%) PRINCE2 Certification
Quality Assurance & Compliance
1 11 (8.03%) PMO
2 5 (3.65%) QA
3 4 (2.92%) SLA
4 2 (1.46%) GDPR
4 2 (1.46%) NIST
5 1 (0.73%) COBIT
5 1 (0.73%) Cyber Essentials
5 1 (0.73%) Cyber Essentials PLUS
5 1 (0.73%) Data Quality
5 1 (0.73%) ISO 19650
5 1 (0.73%) ISO/IEC 27001
5 1 (0.73%) ISO/IEC 27005
5 1 (0.73%) NEBOSH
System Software
1 1 (0.73%) Active Directory
Systems Management
1 2 (1.46%) Microsoft Intune
Vendors
1 20 (14.60%) PayPal
2 16 (11.68%) Microsoft
3 7 (5.11%) Google
4 5 (3.65%) Autodesk
4 5 (3.65%) Concur
5 4 (2.92%) Facebook
5 4 (2.92%) Salesforce
5 4 (2.92%) Salesforce Marketing Cloud
6 3 (2.19%) Adobe
6 3 (2.19%) Dell
6 3 (2.19%) HP
7 2 (1.46%) Apple
7 2 (1.46%) Instagram
7 2 (1.46%) TikTok
7 2 (1.46%) YouTube
8 1 (0.73%) Criteo
8 1 (0.73%) Freshdesk
8 1 (0.73%) Juniper
8 1 (0.73%) Palo Alto
8 1 (0.73%) Ruckus Wireless