.NET Contracts in the City of London

Microsoft .NET (dotNet)
Central London > City of London

The table below provides summary statistics for contract job vacancies advertised in the City of London requiring .NET skills. It includes a benchmarking guide to the contractor rates offered in vacancies that cited .NET over the 6 months leading up to 1 July 2025, comparing them to the same period in the previous two years.

6 months to
1 Jul 2025
Same period 2024 Same period 2023
Rank 43 31 34
Rank change year-on-year -12 +3 -4
Contract jobs citing .NET 86 120 194
As % of all contract jobs advertised in the City of London 4.88% 5.67% 5.61%
As % of the Libraries, Frameworks & Software Standards category 19.11% 23.86% 21.02%
Number of daily rates quoted 55 83 131
10th Percentile £404 £408 £451
25th Percentile £424 £463 £538
Median daily rate (50th Percentile) £550 £550 £650
Median % change year-on-year - -15.38% +4.00%
75th Percentile £681 £675 £758
90th Percentile £798 £748 £838
Central London median daily rate £550 £540 £650
% change year-on-year +1.85% -16.92% +5.26%

All Software Libraries and Frameworks
City of London

.NET falls under the Software Libraries and Frameworks category. For comparison with the information above, the following table provides summary statistics for all contract job vacancies requiring technical specification, industry standards, software libraries and framework skills in the City of London.

Contract vacancies with a requirement for technical specification, industry standards, software libraries and framework skills 450 503 923
As % of all contract IT jobs advertised in the City of London 25.52% 23.77% 26.69%
Number of daily rates quoted 292 347 588
10th Percentile £404 £410 £425
25th Percentile £453 £475 £505
Median daily rate (50th Percentile) £559 £575 £625
Median % change year-on-year -2.87% -8.00% +4.17%
75th Percentile £675 £706 £738
90th Percentile £763 £793 £827
Central London median daily rate £550 £564 £625
% change year-on-year -2.44% -9.80% +4.17%
Number of hourly rates quoted 1 0 1
10th Percentile - - -
25th Percentile £86.25 - -
Median hourly rate £87.50 - £53.00
Median % change year-on-year - - +11.58%
75th Percentile £88.75 - -
90th Percentile - - -
Central London median hourly rate £69.47 - £53.00
% change year-on-year - - +11.58%

.NET
Job Vacancy Trend in the City of London

Job postings citing .NET as a proportion of all IT jobs advertised in the City of London.
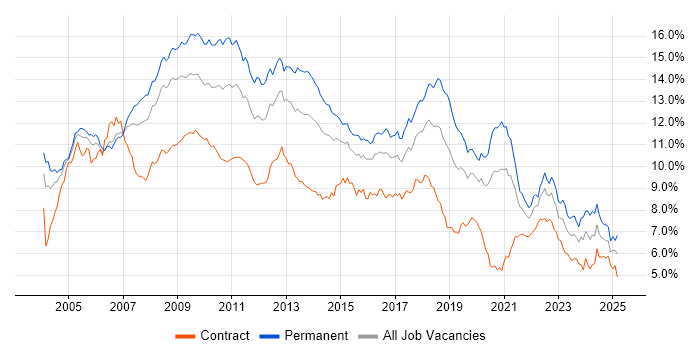
Job vacancy trend for .NET in the City of London

.NET
Contractor Daily Rate Trend in the City of London

3-month moving average daily rate quoted in jobs citing .NET in the City of London.

Daily rate trend for .NET in the City of London

.NET
Daily Rate Histogram in the City of London

Daily rate distribution for jobs citing .NET in the City of London over the 6 months to 1 July 2025.

Daily rate histogram for .NET in the City of London

.NET
Contractor Hourly Rate Trend in the City of London

3-month moving average hourly rates quoted in jobs citing .NET in the City of London.

Hourly rate trend for .NET in the City of London

.NET
Co-occurring Skills and Capabilities in the City of London by Category

The follow tables expand on the table above by listing co-occurrences grouped by category. The same employment type, locality and period is covered with up to 20 co-occurrences shown in each of the following categories:

Application Platforms
1 5 (5.81%) SharePoint
2 2 (2.33%) Confluence
2 2 (2.33%) Microsoft Exchange
3 1 (1.16%) Apache
3 1 (1.16%) Apache Spark
3 1 (1.16%) CMS
3 1 (1.16%) Drupal
3 1 (1.16%) Oracle SOA Suite
Applications
1 7 (8.14%) Microsoft Excel
2 1 (1.16%) Microsoft Office
2 1 (1.16%) Spreadsheet
Business Applications
1 5 (5.81%) Endur
2 4 (4.65%) Dynamics CRM
3 3 (3.49%) OpenText MBPM
3 3 (3.49%) Oracle BPM
4 2 (2.33%) Salesforce CRM
4 2 (2.33%) Workday HCM
5 1 (1.16%) Fidessa
5 1 (1.16%) Maximo
Cloud Services
1 42 (48.84%) Azure
2 15 (17.44%) Azure DevOps
3 13 (15.12%) AWS
4 9 (10.47%) Power Platform
5 6 (6.98%) Azure Data Factory
6 5 (5.81%) Amazon EKS
6 5 (5.81%) Azure Monitor
6 5 (5.81%) GitHub
7 4 (4.65%) Azure Sentinel
7 4 (4.65%) Dynamics 365
8 3 (3.49%) Azure AKS
8 3 (3.49%) Azure App Service
8 3 (3.49%) Azure Key Vault
8 3 (3.49%) Microsoft 365
8 3 (3.49%) PaaS
8 3 (3.49%) Power Automate
8 3 (3.49%) PowerApps
9 2 (2.33%) Amazon S3
9 2 (2.33%) Azure Service Bus
9 2 (2.33%) npm
Communications & Networking
1 2 (2.33%) DNS
1 2 (2.33%) Firewall
1 2 (2.33%) FTP
1 2 (2.33%) HTTP
1 2 (2.33%) SMTP
1 2 (2.33%) SSL
1 2 (2.33%) TCP/IP
2 1 (1.16%) Network Security
Database & Business Intelligence
1 24 (27.91%) SQL Server
2 6 (6.98%) SQL Server Reporting Services
3 5 (5.81%) NoSQL
4 4 (4.65%) Azure SQL Database
5 3 (3.49%) Oracle Database
5 3 (3.49%) PostgreSQL
6 2 (2.33%) Data Lake
6 2 (2.33%) MongoDB
6 2 (2.33%) Power BI
6 2 (2.33%) Relational Database
7 1 (1.16%) Amazon RDS
7 1 (1.16%) Big Data
7 1 (1.16%) DB2
7 1 (1.16%) RDBMS
7 1 (1.16%) Redis
7 1 (1.16%) Snowflake Schema
7 1 (1.16%) Star Schema
Development Applications
1 10 (11.63%) Git
2 4 (4.65%) Jenkins
2 4 (4.65%) JIRA
3 2 (2.33%) Ant
3 2 (2.33%) Babel
3 2 (2.33%) Bitbucket
3 2 (2.33%) NUnit
3 2 (2.33%) TeamCity
3 2 (2.33%) webpack
4 1 (1.16%) Atlassian Bamboo
4 1 (1.16%) Crucible
4 1 (1.16%) Cucumber
4 1 (1.16%) Maven
4 1 (1.16%) Postman
4 1 (1.16%) Selenium
4 1 (1.16%) Visual Studio
General
1 41 (47.67%) Finance
2 23 (26.74%) Banking
3 19 (22.09%) Social Skills
4 14 (16.28%) Front Office
5 6 (6.98%) Analytical Skills
6 5 (5.81%) Presentation Skills
7 4 (4.65%) Back Office
8 3 (3.49%) Investment Banking
9 2 (2.33%) Documentation Skills
9 2 (2.33%) Legal
9 2 (2.33%) Marketing
9 2 (2.33%) Public Sector
10 1 (1.16%) Billing
10 1 (1.16%) Financial Institution
10 1 (1.16%) Inclusion and Diversity
10 1 (1.16%) Influencing Skills
10 1 (1.16%) Retail
Job Titles
1 47 (54.65%) Developer
2 15 (17.44%) .NET Developer
2 15 (17.44%) Senior
3 10 (11.63%) Software Engineer
4 7 (8.14%) Senior Developer
5 6 (6.98%) C# Developer
5 6 (6.98%) Full-Stack Developer
5 6 (6.98%) Senior .NET Developer
6 5 (5.81%) Applications Developer
6 5 (5.81%) Lead
6 5 (5.81%) OpenLink Developer
7 4 (4.65%) Angular Developer
7 4 (4.65%) Architect
7 4 (4.65%) Automation Developer
7 4 (4.65%) C# .NET Developer
7 4 (4.65%) Senior Software Engineer
7 4 (4.65%) Solutions Architect
8 3 (3.49%) Algorithm Engineer
8 3 (3.49%) Azure Engineer
8 3 (3.49%) React Developer
Libraries, Frameworks & Software Standards
1 12 (13.95%) HTML
2 11 (12.79%) .NET Core
3 10 (11.63%) CSS
4 9 (10.47%) AngularJS
4 9 (10.47%) REST
5 8 (9.30%) .NET Framework
5 8 (9.30%) Web Services
6 7 (8.14%) React
6 7 (8.14%) RESTful
7 6 (6.98%) ASP.NET
7 6 (6.98%) Entity Framework
7 6 (6.98%) WPF
8 4 (4.65%) ASP.NET Core
8 4 (4.65%) Blazor
8 4 (4.65%) HTML5
8 4 (4.65%) jQuery
8 4 (4.65%) Vue
9 3 (3.49%) Kafka
9 3 (3.49%) Lightning Web Components
9 3 (3.49%) Node.js
Miscellaneous
1 7 (8.14%) Legacy Systems
2 4 (4.65%) Cloud Native
2 4 (4.65%) Distributed Systems
2 4 (4.65%) Greenfield Project
3 3 (3.49%) Enterprise Software
4 2 (2.33%) Algorithms
4 2 (2.33%) Equities
4 2 (2.33%) Foreign Exchange (FX)
4 2 (2.33%) Low-Code
4 2 (2.33%) Mobile App
4 2 (2.33%) Onboarding
4 2 (2.33%) Product Ownership
5 1 (1.16%) AS400
5 1 (1.16%) Data Structures
5 1 (1.16%) Fixed Income
5 1 (1.16%) Legacy Applications
5 1 (1.16%) Legacy Code
5 1 (1.16%) Self-Motivation
5 1 (1.16%) TWAP
5 1 (1.16%) VWAP
Operating Systems
1 4 (4.65%) Windows
Processes & Methodologies
1 28 (32.56%) DevOps
2 23 (26.74%) CI/CD
3 22 (25.58%) Agile
4 18 (20.93%) Full-Stack Development
4 18 (20.93%) Software Engineering
5 14 (16.28%) Microservices
6 12 (13.95%) Data Analysis
7 11 (12.79%) Problem-Solving
7 11 (12.79%) Unit Testing
8 10 (11.63%) Test Automation
9 9 (10.47%) Continuous Improvement
9 9 (10.47%) Front End Development
10 8 (9.30%) Disaster Recovery
11 7 (8.14%) MVC
12 6 (6.98%) Code Quality
12 6 (6.98%) CRM
12 6 (6.98%) Infrastructure as Code
12 6 (6.98%) Kanban
12 6 (6.98%) Site Reliability Engineering
12 6 (6.98%) User Acceptance Testing
Programming Languages
1 64 (74.42%) C#
2 32 (37.21%) SQL
3 26 (30.23%) JavaScript
4 16 (18.60%) Python
5 10 (11.63%) Java
6 5 (5.81%) PowerShell
6 5 (5.81%) TypeScript
7 3 (3.49%) Bicep
7 3 (3.49%) VBA
8 2 (2.33%) Kusto Query Language
8 2 (2.33%) Ruby
9 1 (1.16%) C++
9 1 (1.16%) COBOL
9 1 (1.16%) Groovy
9 1 (1.16%) Perl
9 1 (1.16%) PHP
9 1 (1.16%) PL/SQL
9 1 (1.16%) RPG
9 1 (1.16%) T-SQL
9 1 (1.16%) VB.NET
Qualifications
1 3 (3.49%) Degree
1 3 (3.49%) Security Cleared
2 1 (1.16%) Azure Certification
2 1 (1.16%) BPSS Clearance
2 1 (1.16%) CFA
2 1 (1.16%) Computer Science Degree
2 1 (1.16%) Microsoft Certification
2 1 (1.16%) SC Cleared
Quality Assurance & Compliance
1 11 (12.79%) QA
2 4 (4.65%) EMIR
2 4 (4.65%) MiFID
3 3 (3.49%) Accessibility
4 2 (2.33%) COBIT
4 2 (2.33%) GDPR
5 1 (1.16%) Data Quality
5 1 (1.16%) PCI DSS
System Software
1 6 (6.98%) Docker
Systems Management
1 10 (11.63%) Kubernetes
2 4 (4.65%) Prometheus
3 3 (3.49%) Grafana
3 3 (3.49%) Terraform
4 1 (1.16%) Control-M
4 1 (1.16%) Istio
Vendors
1 16 (18.60%) Microsoft
2 15 (17.44%) Oracle
3 7 (8.14%) Databricks
4 5 (5.81%) OpenLink
5 4 (4.65%) ServiceNow
6 3 (3.49%) IBM
6 3 (3.49%) OpenText
6 3 (3.49%) Salesforce
6 3 (3.49%) UiPath
7 2 (2.33%) Bloomberg
7 2 (2.33%) Workday
8 1 (1.16%) AppDynamics
8 1 (1.16%) Avaloq
8 1 (1.16%) CQG
8 1 (1.16%) FNZ
8 1 (1.16%) ION Trading
8 1 (1.16%) Reuters
8 1 (1.16%) Splunk
8 1 (1.16%) Talend