C# Contracts in the City of London

C#
Central London > City of London

The table below provides summary statistics for contract job vacancies advertised in the City of London requiring C# skills. It includes a benchmarking guide to the contractor rates offered in vacancies that cited C# over the 6 months leading up to 14 November 2024, comparing them to the same period in the previous two years.

6 months to
14 Nov 2024
Same period 2023 Same period 2022
Rank 31 22 14
Rank change year-on-year -9 -8 +7
Contract jobs citing C# 118 228 494
As % of all contract jobs advertised in the City of London 5.56% 8.21% 11.00%
As % of the Programming Languages category 15.82% 23.60% 23.09%
Number of daily rates quoted 81 159 234
10th Percentile £400 £451 £433
25th Percentile £525 £550 £513
Median daily rate (50th Percentile) £625 £655 £624
Median % change year-on-year -4.58% +5.01% +7.59%
75th Percentile £688 £788 £713
90th Percentile £825 £850 £800
Central London median daily rate £650 £653 £624
% change year-on-year -0.38% +4.61% +7.59%

All Programming Languages
City of London

C# falls under the Programming Languages category. For comparison with the information above, the following table provides summary statistics for all contract job vacancies requiring coding skills in the City of London.

Contract vacancies with a requirement for coding skills 746 966 2,139
As % of all contract IT jobs advertised in the City of London 35.14% 34.79% 47.64%
Number of daily rates quoted 477 672 1,331
10th Percentile £406 £400 £425
25th Percentile £484 £475 £500
Median daily rate (50th Percentile) £593 £600 £600
Median % change year-on-year -1.25% - -
75th Percentile £700 £725 £725
90th Percentile £825 £838 £825
Central London median daily rate £585 £600 £593
% change year-on-year -2.50% +1.27% -1.25%
Number of hourly rates quoted 3 2 19
10th Percentile £51.80 £15.65 £19.95
25th Percentile £74.38 £20.75 £31.75
Median hourly rate £112.00 £30.00 £52.50
Median % change year-on-year +273.33% -42.86% +19.32%
75th Percentile - £39.75 £58.75
90th Percentile - £45.15 £68.35
Central London median hourly rate £41.50 £30.00 £52.50
% change year-on-year +38.33% -42.86% +43.84%

C#
Job Vacancy Trend in the City of London

Job postings citing C# as a proportion of all IT jobs advertised in the City of London.
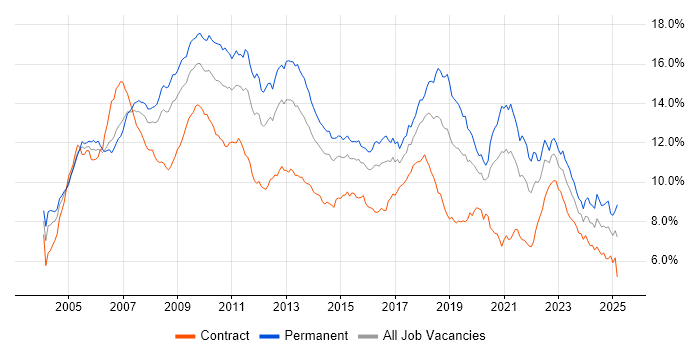
Job vacancy trend for C# in the City of London

C#
Contractor Daily Rate Trend in the City of London

3-month moving average daily rate quoted in jobs citing C# in the City of London.

Daily rate trend for C# in the City of London

C#
Daily Rate Histogram in the City of London

Daily rate distribution for jobs citing C# in the City of London over the 6 months to 14 November 2024.

Daily rate histogram for C# in the City of London

C#
Contractor Hourly Rate Trend in the City of London

3-month moving average hourly rates quoted in jobs citing C# in the City of London.

Hourly rate trend for C# in the City of London

C#
Co-occurring Skills and Capabilities in the City of London by Category

The follow tables expand on the table above by listing co-occurrences grouped by category. The same employment type, locality and period is covered with up to 20 co-occurrences shown in each of the following categories:

Application Platforms
1 3 (2.54%) Confluence
1 3 (2.54%) SharePoint
2 1 (0.85%) IIS
2 1 (0.85%) JBoss
2 1 (0.85%) Microsoft Exchange
2 1 (0.85%) Umbraco
Applications
1 3 (2.54%) Microsoft Excel
2 1 (0.85%) Microsoft Office
2 1 (0.85%) Microsoft PowerPoint
2 1 (0.85%) MS Visio
2 1 (0.85%) Spreadsheet
Business Applications
1 3 (2.54%) Endur
2 2 (1.69%) Dynamics CRM
3 1 (0.85%) Oracle EBS
Cloud Services
1 63 (53.39%) Azure
2 24 (20.34%) Azure DevOps
3 14 (11.86%) Azure Service Bus
4 11 (9.32%) Azure App Service
5 10 (8.47%) AWS
5 10 (8.47%) Azure AKS
5 10 (8.47%) Azure Event Grid
6 9 (7.63%) Power Platform
7 5 (4.24%) Serverless
8 4 (3.39%) Dynamics 365
8 4 (3.39%) GCP
9 3 (2.54%) Azure Cosmos DB
9 3 (2.54%) Entra ID
9 3 (2.54%) GitHub
10 2 (1.69%) Azure API Management
10 2 (1.69%) Azure Data Factory
10 2 (1.69%) Azure Key Vault
10 2 (1.69%) Azure Monitor
10 2 (1.69%) Azure Pipelines
10 2 (1.69%) npm
Communications & Networking
1 1 (0.85%) Firewall
1 1 (0.85%) HTTP
1 1 (0.85%) Internet
1 1 (0.85%) Intranet
1 1 (0.85%) Kerberos
1 1 (0.85%) Multicast
1 1 (0.85%) SAN
1 1 (0.85%) SSL
Database & Business Intelligence
1 50 (42.37%) SQL Server
2 16 (13.56%) NoSQL
3 15 (12.71%) Azure SQL Database
4 8 (6.78%) SQL Server Integration Services
5 6 (5.08%) Power BI
5 6 (5.08%) Redis
6 4 (3.39%) SQL Server Reporting Services
7 3 (2.54%) Crystal Reports
7 3 (2.54%) MongoDB
7 3 (2.54%) Oracle Database
7 3 (2.54%) Relational Database
8 2 (1.69%) Amazon Aurora
8 2 (1.69%) Data Warehouse
8 2 (1.69%) DocumentDB
8 2 (1.69%) Elasticsearch
9 1 (0.85%) KDB
9 1 (0.85%) Microsoft Analysis Services
9 1 (0.85%) MS Access
9 1 (0.85%) PostgreSQL
9 1 (0.85%) Sybase ASE
Development Applications
1 13 (11.02%) SpecFlow
2 12 (10.17%) JIRA
3 11 (9.32%) Selenium
4 8 (6.78%) Jenkins
5 6 (5.08%) TeamCity
6 5 (4.24%) Git
6 5 (4.24%) Octopus Deploy
6 5 (4.24%) Visual Studio
7 4 (3.39%) TestRail
8 3 (2.54%) NUnit
8 3 (2.54%) SonarQube
8 3 (2.54%) Team Foundation Server
9 2 (1.69%) JMeter
9 2 (1.69%) MSTest
10 1 (0.85%) Ant
10 1 (0.85%) Eclipse
10 1 (0.85%) IntelliJ
10 1 (0.85%) Maven
10 1 (0.85%) Subversion
10 1 (0.85%) Visual Studio Team System
General
1 39 (33.05%) Finance
2 31 (26.27%) Banking
3 16 (13.56%) Social Skills
4 11 (9.32%) Front Office
5 9 (7.63%) Back Office
6 8 (6.78%) Analytical Skills
7 7 (5.93%) Investment Banking
8 5 (4.24%) Public Sector
9 2 (1.69%) Presentation Skills
9 2 (1.69%) Retail Banking
10 1 (0.85%) Agriculture
10 1 (0.85%) Financial Institution
10 1 (0.85%) International Banking
10 1 (0.85%) Legal
Job Titles
1 66 (55.93%) Developer
2 28 (23.73%) C# Developer
3 20 (16.95%) .NET Developer
4 17 (14.41%) Senior
5 12 (10.17%) Senior Developer
6 10 (8.47%) Azure Developer
6 10 (8.47%) C# .NET Developer
6 10 (8.47%) Lead
7 9 (7.63%) Tester
8 8 (6.78%) Software Engineer
9 7 (5.93%) Analyst
9 7 (5.93%) Full-Stack Developer
10 6 (5.08%) SQL Developer
11 5 (4.24%) Azure Engineer
11 5 (4.24%) React Developer
12 4 (3.39%) Analyst Developer
12 4 (3.39%) C++ Developer
12 4 (3.39%) Exploratory Tester
12 4 (3.39%) Senior C# Developer
12 4 (3.39%) Test Leader
Libraries, Frameworks & Software Standards
1 79 (66.95%) .NET
2 21 (17.80%) .NET Core
2 21 (17.80%) .NET Framework
2 21 (17.80%) React
3 20 (16.95%) Kafka
4 10 (8.47%) ASP.NET
5 9 (7.63%) HTML
6 8 (6.78%) ADO
6 8 (6.78%) AngularJS
6 8 (6.78%) CSS
6 8 (6.78%) FIX Protocol
6 8 (6.78%) REST
6 8 (6.78%) RESTful
7 7 (5.93%) Blazor
7 7 (5.93%) Node.js
8 6 (5.08%) Entity Framework
8 6 (5.08%) HTML5
8 6 (5.08%) WPF
9 5 (4.24%) CSS3
9 5 (4.24%) RabbitMQ
Miscellaneous
1 8 (6.78%) Derivative
1 8 (6.78%) Foreign Exchange (FX)
2 4 (3.39%) Self-Motivation
3 3 (2.54%) Fixed Income
3 3 (2.54%) Greenfield Project
3 3 (2.54%) Sports Betting
4 2 (1.69%) Algorithms
4 2 (1.69%) Cloud Native
4 2 (1.69%) Data Centre
4 2 (1.69%) Legacy Applications
4 2 (1.69%) Legacy Systems
4 2 (1.69%) Public Cloud
5 1 (0.85%) Analytical Mindset
5 1 (0.85%) Data Structures
5 1 (0.85%) Enterprise Software
5 1 (0.85%) Low-Code
5 1 (0.85%) Onboarding
5 1 (0.85%) Product Ownership
5 1 (0.85%) Renewable Energy
5 1 (0.85%) Virtual Team
Operating Systems
1 6 (5.08%) Windows
2 2 (1.69%) Linux
3 1 (0.85%) Oracle Linux
3 1 (0.85%) Red Hat Enterprise Linux
3 1 (0.85%) Solaris
3 1 (0.85%) Unix
3 1 (0.85%) Windows Server
Processes & Methodologies
1 42 (35.59%) DevOps
2 37 (31.36%) Agile
3 27 (22.88%) SDLC
4 24 (20.34%) Test Automation
5 21 (17.80%) CI/CD
6 17 (14.41%) Design Patterns
7 12 (10.17%) Problem-Solving
7 12 (10.17%) Scrum
8 11 (9.32%) Full-Stack Development
9 10 (8.47%) Architectural Design
9 10 (8.47%) Architectural Patterns
9 10 (8.47%) Microservices
9 10 (8.47%) TDD
9 10 (8.47%) Unit Testing
10 9 (7.63%) Migration
10 9 (7.63%) Software Engineering
11 8 (6.78%) Analytics
11 8 (6.78%) Change Management
11 8 (6.78%) Event-Driven
12 7 (5.93%) Exploratory Testing
Programming Languages
1 54 (45.76%) SQL
2 19 (16.10%) JavaScript
3 14 (11.86%) Python
4 11 (9.32%) T-SQL
5 10 (8.47%) TypeScript
6 9 (7.63%) C++
6 9 (7.63%) PowerShell
7 7 (5.93%) VBA
8 6 (5.08%) Java
8 6 (5.08%) PL/SQL
9 5 (4.24%) VB.NET
10 2 (1.69%) R
11 1 (0.85%) Bash
11 1 (0.85%) Clojure
11 1 (0.85%) Go
11 1 (0.85%) Haskell
11 1 (0.85%) Ruby
11 1 (0.85%) Rust
11 1 (0.85%) XAML
Qualifications
1 6 (5.08%) Degree
2 5 (4.24%) Security Cleared
3 4 (3.39%) SC Cleared
4 2 (1.69%) Computer Science Degree
4 2 (1.69%) Master's Degree
4 2 (1.69%) Microsoft Certification
5 1 (0.85%) Azure Certification
5 1 (0.85%) BPSS Clearance
Quality Assurance & Compliance
1 9 (7.63%) QA
2 5 (4.24%) EMIR
2 5 (4.24%) MiFID
3 3 (2.54%) Accessibility
4 2 (1.69%) Data Quality
4 2 (1.69%) WCAG
5 1 (0.85%) SLA
5 1 (0.85%) Software Quality Assurance
System Software
1 11 (9.32%) Docker
2 2 (1.69%) Active Directory
3 1 (0.85%) Ceph
Systems Management
1 18 (15.25%) Kubernetes
2 6 (5.08%) Terraform
3 2 (1.69%) Grafana
4 1 (0.85%) Ansible
4 1 (0.85%) EMC NetWorker
4 1 (0.85%) Kibana
4 1 (0.85%) Netcool
4 1 (0.85%) Prometheus
4 1 (0.85%) Tivoli
4 1 (0.85%) Tivoli Storage Manager
Vendors
1 43 (36.44%) Microsoft
2 14 (11.86%) Oracle
3 4 (3.39%) OpenLink
4 2 (1.69%) Informatica
4 2 (1.69%) ION Trading
4 2 (1.69%) ServiceNow
4 2 (1.69%) Solace
4 2 (1.69%) Sybase
4 2 (1.69%) TIBCO
5 1 (0.85%) Cisco
5 1 (0.85%) CyberArk
5 1 (0.85%) Databricks
5 1 (0.85%) EMC
5 1 (0.85%) IBM
5 1 (0.85%) iManage
5 1 (0.85%) Isilon
5 1 (0.85%) Murex
5 1 (0.85%) Qualys
5 1 (0.85%) Splunk
5 1 (0.85%) SunGard