Microsoft Office Contracts in the City of London

Microsoft Office
Central London > City of London

The table below provides summary statistics for contract job vacancies advertised in the City of London requiring Microsoft Office skills. It includes a benchmarking guide to the contractor rates offered in vacancies that cited Microsoft Office over the 6 months leading up to 1 April 2025, comparing them to the same period in the previous two years.

6 months to
1 Apr 2025
Same period 2024 Same period 2023
Rank 62 65 79
Rank change year-on-year +3 +14 +12
Contract jobs citing Microsoft Office 59 65 112
As % of all contract jobs advertised in the City of London 3.41% 2.82% 2.89%
As % of the Applications category 34.71% 44.52% 35.90%
Number of daily rates quoted 34 49 78
10th Percentile £246 £143 £150
25th Percentile £281 £206 £231
Median daily rate (50th Percentile) £425 £350 £400
Median % change year-on-year +21.43% -12.50% +48.15%
75th Percentile £590 £619 £550
90th Percentile £668 £678 £738
Central London median daily rate £425 £375 £375
% change year-on-year +13.33% - +41.51%
Number of hourly rates quoted 0 3 1
10th Percentile - - -
25th Percentile - £12.75 £28.75
Median hourly rate - £13.50 £32.50
Median % change year-on-year - -58.46% -7.14%
75th Percentile - £16.59 £36.25
90th Percentile - £17.99 -
Central London median hourly rate - £16.22 £32.50
% change year-on-year - -50.11% -7.14%

All Software Application Skills
City of London

Microsoft Office falls under the Software Applications category. For comparison with the information above, the following table provides summary statistics for all contract job vacancies requiring software application skills in the City of London.

Contract vacancies with a requirement for software application skills 170 146 312
As % of all contract IT jobs advertised in the City of London 9.82% 6.35% 8.04%
Number of daily rates quoted 107 92 206
10th Percentile £233 £150 £210
25th Percentile £309 £261 £353
Median daily rate (50th Percentile) £475 £519 £513
Median % change year-on-year -8.43% +1.22% +2.50%
75th Percentile £606 £638 £650
90th Percentile £725 £723 £738
Central London median daily rate £475 £486 £510
% change year-on-year -2.26% -4.71% +4.88%
Number of hourly rates quoted 2 4 5
10th Percentile £35.79 - £14.61
25th Percentile £37.53 £12.75 £15.25
Median hourly rate £41.08 £16.22 £32.50
Median % change year-on-year +153.31% -50.11% -31.58%
75th Percentile £45.23 £19.52 £52.75
90th Percentile £47.34 £20.58 £53.35
Central London median hourly rate £34.65 £18.93 £32.50
% change year-on-year +83.04% -41.75% -31.58%

Microsoft Office
Job Vacancy Trend in the City of London

Job postings citing Microsoft Office as a proportion of all IT jobs advertised in the City of London.
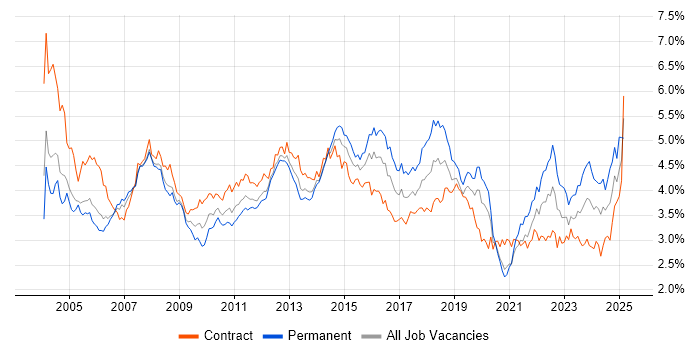
Job vacancy trend for Microsoft Office in the City of London

Microsoft Office
Contractor Daily Rate Trend in the City of London

3-month moving average daily rate quoted in jobs citing Microsoft Office in the City of London.

Daily rate trend for Microsoft Office in the City of London

Microsoft Office
Daily Rate Histogram in the City of London

Daily rate distribution for jobs citing Microsoft Office in the City of London over the 6 months to 1 April 2025.

Daily rate histogram for Microsoft Office in the City of London

Microsoft Office
Contractor Hourly Rate Trend in the City of London

3-month moving average hourly rates quoted in jobs citing Microsoft Office in the City of London.

Hourly rate trend for Microsoft Office in the City of London

Microsoft Office
Contract Job Locations in the City of London

The table below looks at the demand and provides a guide to the median contractor rates quoted in IT jobs citing Microsoft Office within the City of London region over the 6 months to 1 April 2025. The 'Rank Change' column provides an indication of the change in demand within each location based on the same 6 month period last year.

Location Rank Change
on Same Period
Last Year
Matching
Contract
IT Job Ads
Median
Daily Rate
Past 6 Months
Median Daily Rate
% Change
on Same Period
Last Year
Live
Jobs
London Bridge - 1 £238 -
Moorgate - 1 £230 -
Microsoft Office
Central London

Microsoft Office
Co-occurring Skills and Capabilities in the City of London by Category

The follow tables expand on the table above by listing co-occurrences grouped by category. The same employment type, locality and period is covered with up to 20 co-occurrences shown in each of the following categories:

Application Platforms
1 12 (20.34%) SharePoint
2 7 (11.86%) Microsoft Exchange
3 5 (8.47%) Confluence
4 3 (5.08%) CMS
5 1 (1.69%) Apache Spark
5 1 (1.69%) Exchange Server 2010
5 1 (1.69%) SharePoint 2013
5 1 (1.69%) Skype for Business
Applications
1 23 (38.98%) Microsoft Excel
2 15 (25.42%) Microsoft PowerPoint
3 10 (16.95%) MS Visio
4 6 (10.17%) Microsoft Project
5 2 (3.39%) Adobe Creative Suite
5 2 (3.39%) Spreadsheet
6 1 (1.69%) Revit
6 1 (1.69%) Trello
Business Applications
1 1 (1.69%) CA PPM
1 1 (1.69%) Dynamics CRM
1 1 (1.69%) SAP CAR
1 1 (1.69%) SAP MDG
1 1 (1.69%) SAP MM
1 1 (1.69%) SAP Retail
Cloud Services
1 19 (32.20%) Microsoft 365
2 10 (16.95%) Azure
3 5 (8.47%) Power Platform
4 3 (5.08%) Asana
4 3 (5.08%) AWS
5 2 (3.39%) Entra ID
5 2 (3.39%) IBM Blueworks
6 1 (1.69%) Dynamics 365
6 1 (1.69%) Miro
6 1 (1.69%) OneDrive
6 1 (1.69%) Power Automate
6 1 (1.69%) PowerApps
Communications & Networking
1 2 (3.39%) Firewall
1 2 (3.39%) VPN
1 2 (3.39%) Wireless
2 1 (1.69%) IPsec
2 1 (1.69%) iSCSI
2 1 (1.69%) LAN
2 1 (1.69%) Network Security
2 1 (1.69%) Skype
2 1 (1.69%) SSL
2 1 (1.69%) Unified Communications
2 1 (1.69%) WAN
2 1 (1.69%) Wi-Fi
Database & Business Intelligence
1 4 (6.78%) Power BI
2 2 (3.39%) Power Query
2 2 (3.39%) Tableau
3 1 (1.69%) BigQuery
3 1 (1.69%) Data Lake
3 1 (1.69%) Data Warehouse
3 1 (1.69%) DTS
3 1 (1.69%) Essbase
3 1 (1.69%) Hadoop
3 1 (1.69%) Looker
3 1 (1.69%) NoSQL
3 1 (1.69%) Relational Database
Development Applications
1 9 (15.25%) JIRA
2 1 (1.69%) Cypress.io
General
1 31 (52.54%) Social Skills
2 25 (42.37%) Finance
3 8 (13.56%) Banking
4 6 (10.17%) Presentation Skills
4 6 (10.17%) Public Sector
5 5 (8.47%) Analytical Skills
5 5 (8.47%) Documentation Skills
6 4 (6.78%) Financial Institution
6 4 (6.78%) Organisational Skills
7 3 (5.08%) Front Office
7 3 (5.08%) Inclusion and Diversity
7 3 (5.08%) Retail
7 3 (5.08%) Telecoms
8 2 (3.39%) International Banking
8 2 (3.39%) Marketing
8 2 (3.39%) Military
9 1 (1.69%) Arabic Language
9 1 (1.69%) Billing
9 1 (1.69%) Investment Banking
9 1 (1.69%) Local Government
Job Titles
1 12 (20.34%) Analyst
2 6 (10.17%) Developer
2 6 (10.17%) Project Manager
3 5 (8.47%) IT Support
4 4 (6.78%) Business Analyst
5 3 (5.08%) Architect
5 3 (5.08%) Consultant
5 3 (5.08%) Coordinator
5 3 (5.08%) Data Analyst
5 3 (5.08%) Desktop Engineer
5 3 (5.08%) Infrastructure Manager
5 3 (5.08%) Infrastructure Project Manager
5 3 (5.08%) IT Assistant
5 3 (5.08%) IT Support Assistant
5 3 (5.08%) Lead
5 3 (5.08%) Support Analyst
5 3 (5.08%) Support Assistant
5 3 (5.08%) Support Engineer
6 2 (3.39%) Data Business Analyst
6 2 (3.39%) Email Developer
Libraries, Frameworks & Software Standards
1 2 (3.39%) .NET
1 2 (3.39%) .NET Core
1 2 (3.39%) Bootstrap
1 2 (3.39%) CSS
1 2 (3.39%) HTML
1 2 (3.39%) jQuery
2 1 (1.69%) AngularJS
2 1 (1.69%) Jest
2 1 (1.69%) MIDP
2 1 (1.69%) OAuth
2 1 (1.69%) OAuth2
2 1 (1.69%) REST
Miscellaneous
1 6 (10.17%) Management Information System
2 3 (5.08%) Onboarding
2 3 (5.08%) Self-Motivation
2 3 (5.08%) Video Conferencing
3 2 (3.39%) Greenfield Project
4 1 (1.69%) Blackberry
4 1 (1.69%) BYOD
4 1 (1.69%) Data Centre
4 1 (1.69%) Derivative
4 1 (1.69%) Fixed Income
4 1 (1.69%) Foreign Exchange (FX)
4 1 (1.69%) iPad
4 1 (1.69%) iPhone
4 1 (1.69%) IVR
4 1 (1.69%) Market Risk
4 1 (1.69%) PMI
4 1 (1.69%) Product Ownership
4 1 (1.69%) Reference Data
Operating Systems
1 19 (32.20%) Windows
2 13 (22.03%) Windows 10
3 5 (8.47%) Apple iOS
4 3 (5.08%) Linux
4 3 (5.08%) Unix
5 2 (3.39%) Android
6 1 (1.69%) Windows Server
6 1 (1.69%) Windows Server 2016
Processes & Methodologies
1 16 (27.12%) Problem-Solving
2 14 (23.73%) Project Management
3 10 (16.95%) Agile
3 10 (16.95%) Stakeholder Management
4 9 (15.25%) Migration
5 7 (11.86%) Change Management
6 6 (10.17%) Data Analysis
6 6 (10.17%) ITIL
6 6 (10.17%) Requirements Gathering
7 5 (8.47%) Asset Management
7 5 (8.47%) Business Analysis
7 5 (8.47%) Collaborative Working
7 5 (8.47%) Customer Service
7 5 (8.47%) Data Management
7 5 (8.47%) Decision-Making
7 5 (8.47%) Project Delivery
8 4 (6.78%) Analytics
8 4 (6.78%) Business Intelligence
8 4 (6.78%) Continuous Improvement
8 4 (6.78%) Service Management
Programming Languages
1 6 (10.17%) SQL
2 4 (6.78%) PowerShell
3 3 (5.08%) JavaScript
3 3 (5.08%) Python
4 2 (3.39%) C#
4 2 (3.39%) VBA
5 1 (1.69%) TypeScript
Qualifications
1 10 (16.95%) Degree
2 4 (6.78%) Security Cleared
3 3 (5.08%) SC Cleared
4 2 (3.39%) Microsoft Certification
5 1 (1.69%) A+ Certification
5 1 (1.69%) AWS Certification
5 1 (1.69%) BPSS Clearance
5 1 (1.69%) CBAP
5 1 (1.69%) CCNP
5 1 (1.69%) CCSE
5 1 (1.69%) Cisco Certification
5 1 (1.69%) DBS Check
5 1 (1.69%) IIBA
5 1 (1.69%) PMI Certification
5 1 (1.69%) RIBA
Quality Assurance & Compliance
1 4 (6.78%) SLA
2 2 (3.39%) Accessibility
3 1 (1.69%) Data Quality
3 1 (1.69%) GDPR
3 1 (1.69%) PMO
System Software
1 12 (20.34%) Active Directory
2 2 (3.39%) XenDesktop
3 1 (1.69%) Docker
3 1 (1.69%) VMware ESXi
3 1 (1.69%) XenApp
Systems Management
1 7 (11.86%) Microsoft Intune
2 5 (8.47%) SCCM
3 1 (1.69%) Active Directory Federation Services
3 1 (1.69%) Forefront Identity Manager
Vendors
1 45 (76.27%) Microsoft
2 3 (5.08%) Adobe
2 3 (5.08%) Citrix
2 3 (5.08%) Planview
3 2 (3.39%) Salesforce
3 2 (3.39%) SAP
3 2 (3.39%) ServiceNow
4 1 (1.69%) Apple
4 1 (1.69%) Autodesk
4 1 (1.69%) Bloomberg
4 1 (1.69%) CheckPoint
4 1 (1.69%) Cisco
4 1 (1.69%) Genesys
4 1 (1.69%) HP
4 1 (1.69%) IBM
4 1 (1.69%) Juniper
4 1 (1.69%) Oracle
4 1 (1.69%) Progress
4 1 (1.69%) Reuters
4 1 (1.69%) Veritas