Time Management Jobs in Birmingham

Time Management
West Midlands > Birmingham

The table below provides summary statistics for permanent job vacancies advertised in Birmingham requiring Time Management skills. It includes a benchmarking guide to the annual salaries offered in vacancies that cited Time Management over the 6 months leading up to 15 November 2024, comparing them to the same period in the previous two years.

6 months to
15 Nov 2024
Same period 2023 Same period 2022
Rank 77 88 95
Rank change year-on-year +11 +7 +11
Permanent jobs citing Time Management 52 21 78
As % of all permanent jobs advertised in Birmingham 2.35% 1.69% 2.88%
As % of the Processes & Methodologies category 2.80% 1.81% 2.98%
Number of salaries quoted 5 20 39
10th Percentile £22,775 £26,350 £32,500
25th Percentile £25,625 £29,938 £50,000
Median annual salary (50th Percentile) £45,000 £55,000 £59,500
Median % change year-on-year -18.18% -7.56% +3.48%
75th Percentile £53,750 £61,250 £78,750
90th Percentile £74,750 £68,500 £93,000
West Midlands median annual salary £42,000 £50,000 £50,000
% change year-on-year -16.00% - -

All Process and Methodology Skills
Birmingham

Time Management falls under the Processes and Methodologies category. For comparison with the information above, the following table provides summary statistics for all permanent job vacancies requiring process or methodology skills in Birmingham.

Permanent vacancies with a requirement for process or methodology skills 1,860 1,160 2,618
As % of all permanent jobs advertised in Birmingham 83.90% 93.55% 96.82%
Number of salaries quoted 893 946 1,994
10th Percentile £35,000 £31,427 £34,105
25th Percentile £45,000 £41,250 £45,000
Median annual salary (50th Percentile) £57,500 £55,000 £57,500
Median % change year-on-year +4.55% -4.35% +4.55%
75th Percentile £73,750 £68,750 £74,813
90th Percentile £90,000 £80,070 £85,000
West Midlands median annual salary £55,000 £50,000 £50,050
% change year-on-year +10.00% -0.10% +0.10%

Time Management
Job Vacancy Trend in Birmingham

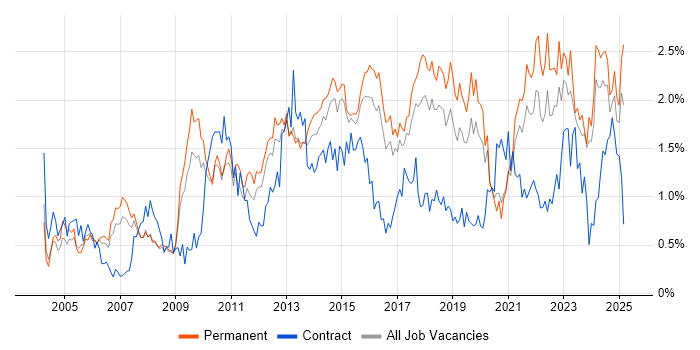
Job postings citing Time Management as a proportion of all IT jobs advertised in Birmingham.

Job vacancy trend for Time Management in Birmingham

Time Management
Salary Trend in Birmingham

3-month moving average salary quoted in jobs citing Time Management in Birmingham.

Salary trend for Time Management in Birmingham

Time Management
Salary Histogram in Birmingham

Salary distribution for jobs citing Time Management in Birmingham over the 6 months to 15 November 2024.

Salary histogram for Time Management in Birmingham

Time Management
Co-occurring Skills and Capabilities in Birmingham by Category

The follow tables expand on the table above by listing co-occurrences grouped by category. The same employment type, locality and period is covered with up to 20 co-occurrences shown in each of the following categories:

Application Platforms
1 2 (3.85%) IIS
Applications
1 3 (5.77%) Microsoft Excel
2 2 (3.85%) MS Visio
3 1 (1.92%) Microsoft Office
3 1 (1.92%) Microsoft PowerPoint
Business Applications
1 7 (13.46%) NEC Housing
Cloud Services
1 7 (13.46%) Azure
1 7 (13.46%) Figma
2 5 (9.62%) SaaS
Communications & Networking
1 5 (9.62%) Cisco Firepower
1 5 (9.62%) SD-WAN
1 5 (9.62%) WAN
Database & Business Intelligence
1 2 (3.85%) SQL Server
1 2 (3.85%) SQL Server Integration Services
1 2 (3.85%) SQL Server Reporting Services
Development Applications
1 7 (13.46%) JIRA
General
1 35 (67.31%) Social Skills
2 12 (23.08%) Inclusion and Diversity
3 10 (19.23%) Organisational Skills
4 8 (15.38%) Finance
4 8 (15.38%) Public Sector
5 7 (13.46%) Local Government
5 7 (13.46%) Police
5 7 (13.46%) Presentation Skills
5 7 (13.46%) Social Housing
6 4 (7.69%) Analytical Skills
7 3 (5.77%) Influencing Skills
8 2 (3.85%) Retail
9 1 (1.92%) Billing
9 1 (1.92%) Law
9 1 (1.92%) Legal
Job Titles
1 17 (32.69%) Architect
2 12 (23.08%) Senior
2 12 (23.08%) Senior Architect
3 11 (21.15%) Analyst
3 11 (21.15%) Business Development Manager
3 11 (21.15%) Business Manager
3 11 (21.15%) Development Manager
4 7 (13.46%) Azure Architect
4 7 (13.46%) Product Manager
4 7 (13.46%) Senior Solutions Architect
4 7 (13.46%) Solutions Architect
5 5 (9.62%) Cisco Architect
5 5 (9.62%) Cisco Security Architect
5 5 (9.62%) Cybersecurity Architect
5 5 (9.62%) Information Analyst
5 5 (9.62%) Information Security Analyst
5 5 (9.62%) Security Analyst
5 5 (9.62%) Security Architect
5 5 (9.62%) Senior Cisco Architect
5 5 (9.62%) Senior Security Architect
Libraries, Frameworks & Software Standards
1 2 (3.85%) .NET
1 2 (3.85%) .NET Framework
1 2 (3.85%) Ajax
1 2 (3.85%) ASP.NET
1 2 (3.85%) CSS
1 2 (3.85%) Entity Framework
1 2 (3.85%) HTML
1 2 (3.85%) jQuery
1 2 (3.85%) Twitter Bootstrap
Miscellaneous
1 11 (21.15%) Life Science
2 10 (19.23%) Data Centre
3 7 (13.46%) Mobile App
4 5 (9.62%) Hybrid Cloud
5 3 (5.77%) Renewable Energy
6 1 (1.92%) Management Information System
Processes & Methodologies
1 24 (46.15%) Presales
2 17 (32.69%) Cybersecurity
2 17 (32.69%) Roadmaps
2 17 (32.69%) Software Licensing
3 16 (30.77%) CRM
4 13 (25.00%) Business Development
5 12 (23.08%) Agile
6 11 (21.15%) B2B
6 11 (21.15%) B2B Sales
7 8 (15.38%) Decision-Making
8 7 (13.46%) Analytics
8 7 (13.46%) Business Case
8 7 (13.46%) Customer Requirements
8 7 (13.46%) Housing Management
8 7 (13.46%) Market Research
8 7 (13.46%) PLM
8 7 (13.46%) Resource Allocation
8 7 (13.46%) User Experience
8 7 (13.46%) UX Design
9 5 (9.62%) Information Security
Programming Languages
1 2 (3.85%) C#
1 2 (3.85%) Java
1 2 (3.85%) JavaScript
Qualifications
1 13 (25.00%) Degree
2 7 (13.46%) DBS Check
3 5 (9.62%) CCNA
3 5 (9.62%) CCNP
3 5 (9.62%) Cisco Certification
3 5 (9.62%) CISM
3 5 (9.62%) CISSP
3 5 (9.62%) CompTIA Security+
3 5 (9.62%) Computer Science Degree
Quality Assurance & Compliance
1 7 (13.46%) Accessibility
2 5 (9.62%) Cyber Essentials
2 5 (9.62%) ISO/IEC 27001
2 5 (9.62%) NIST
3 3 (5.77%) QA
System Software
1 7 (13.46%) Virtual Desktop
Systems Management
1 5 (9.62%) Stealthwatch
Vendors
1 22 (42.31%) Microsoft
2 17 (32.69%) Adobe
2 17 (32.69%) Apple
3 11 (21.15%) Salesforce
4 7 (13.46%) NEC
5 5 (9.62%) Cisco
5 5 (9.62%) Dell
5 5 (9.62%) Meraki
5 5 (9.62%) NetApp
6 2 (3.85%) BT
6 2 (3.85%) Oracle