Validation Job Trends

Validation
UK

The table below provides summary statistics and salary benchmarking for jobs requiring Validation skills. It covers permanent job vacancies from the 6 months leading up to 22 November 2025, with comparisons to the same periods in the previous two years.

6 months to
22 Nov 2025
Same period 2024 Same period 2023
Rank 166 176 197
Rank change year-on-year +10 +21 -63
Permanent jobs citing Validation 853 1,059 909
As % of all permanent jobs in the UK 1.60% 1.55% 1.74%
As % of the Processes & Methodologies category 1.88% 1.84% 1.85%
Number of salaries quoted 467 407 512
10th Percentile £37,000 £36,250 £37,263
25th Percentile £41,250 £45,625 £47,500
Median annual salary (50th Percentile) £60,000 £55,000 £60,000
Median % change year-on-year +9.09% -8.33% -
75th Percentile £80,000 £75,000 £78,938
90th Percentile £95,000 £95,000 £93,625
UK excluding London median annual salary £53,000 £52,600 £55,000
% change year-on-year +0.76% -4.36% +10.00%

All Process and Methodology Skills
UK

Validation falls under the Processes and Methodologies category. For comparison with the information above, the following table provides summary statistics for all permanent job vacancies requiring process or methodology skills.

Permanent vacancies with a requirement for process or methodology skills 45,432 57,470 49,015
As % of all permanent jobs advertised in the UK 85.24% 83.88% 93.81%
Number of salaries quoted 27,673 30,239 37,620
10th Percentile £28,250 £33,975 £32,500
25th Percentile £36,250 £45,000 £43,750
Median annual salary (50th Percentile) £55,000 £60,000 £60,000
Median % change year-on-year -8.33% - -
75th Percentile £75,000 £78,750 £80,000
90th Percentile £95,000 £97,500 £98,750
UK excluding London median annual salary £47,500 £54,150 £52,500
% change year-on-year -12.28% +3.14% -

Validation
Job Vacancy Trend

Historical trend showing the proportion of permanent IT job postings citing Validation relative to all permanent IT jobs advertised.
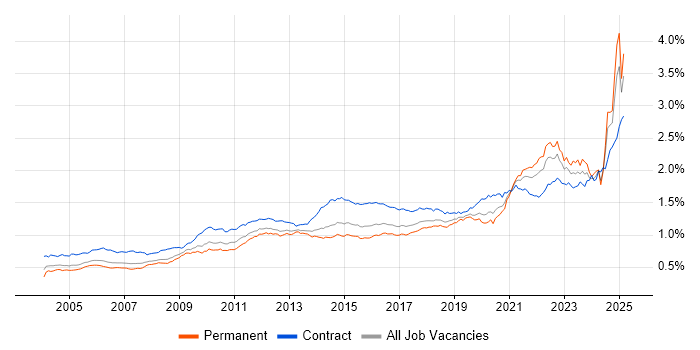
Validation job vacancy trend in the UK

Validation
Salary Trend

Salary distribution trend for jobs in the UK citing Validation.

Salary distribution trend for jobs in the UK citing Validation

Validation
Salary Histogram

Salary distribution for jobs citing Validation over the 6 months to 22 November 2025.

Salary histogram for Validation in the UK

Validation
Top 17 Job Locations

The table below looks at the demand and provides a guide to the median salaries quoted in IT jobs citing Validation within the UK over the 6 months to 22 November 2025. The 'Rank Change' column provides an indication of the change in demand within each location based on the same 6 month period last year.

Location Rank Change
on Same Period
Last Year
Matching
Permanent
IT Job Ads
Median Salary
Past 6 Months
Median Salary
% Change
on Same Period
Last Year
Live
Jobs
England +15 776 £60,000 +9.09% 1,220
UK excluding London +12 558 £53,000 +0.76% 830
London +30 247 £80,000 +14.29% 483
South East +16 204 £52,500 -8.70% 281
Work from Home +66 192 £62,000 - 640
North of England -15 111 £52,500 +15.38% 123
Midlands +67 80 £43,750 -12.50% 131
South West +21 68 £50,000 -16.67% 130
North West -7 66 £52,750 +10.63% 79
East of England -13 56 £57,500 +4.55% 146
West Midlands +48 51 £47,500 -5.00% 87
Yorkshire -3 32 £60,000 +50.00% 29
East Midlands +39 29 £42,500 -10.53% 42
Scotland 0 29 £60,000 +6.18% 48
North East +11 13 £35,000 -26.70% 16
Wales +18 10 £61,250 +24.74% 9
Northern Ireland -3 2 - - 9

Validation
Co-Occurring Skills & Capabilities by Category

The following tables expand on the one above by listing co-occurrences grouped by category. They cover the same employment type, locality and period, with up to 20 co-occurrences shown in each category:

Application Platforms
1 24 (2.81%) Confluence
2 18 (2.11%) Apache Airflow
3 17 (1.99%) Apache Spark
4 10 (1.17%) Apache
4 10 (1.17%) SugarCRM
5 8 (0.94%) CMS
5 8 (0.94%) SharePoint
6 5 (0.59%) SAS
7 4 (0.47%) Headless CMS
8 3 (0.35%) Jupyter
8 3 (0.35%) Microsoft Exchange
9 2 (0.23%) Appian
9 2 (0.23%) WordPress
10 1 (0.12%) Apache Superset
10 1 (0.12%) ArcGIS
10 1 (0.12%) FileNet
10 1 (0.12%) Luigi
Applications
1 54 (6.33%) Microsoft Excel
2 48 (5.63%) Microsoft Office
3 23 (2.70%) Simulink
4 19 (2.23%) MS Visio
5 13 (1.52%) Mathcad
6 9 (1.06%) Microsoft PowerPoint
7 7 (0.82%) AutoCAD
8 4 (0.47%) Blender
8 4 (0.47%) Revit
9 3 (0.35%) Adobe Illustrator
9 3 (0.35%) Oracle Smart View
9 3 (0.35%) Photoshop
9 3 (0.35%) SOLIDWORKS
10 2 (0.23%) Adobe After Effects
10 2 (0.23%) Adobe Captivate
10 2 (0.23%) Adobe Creative Suite
10 2 (0.23%) Adobe Premiere
10 2 (0.23%) Elementor
10 2 (0.23%) Weka
11 1 (0.12%) Navisworks
Business Applications
1 28 (3.28%) SAP S/4HANA
2 8 (0.94%) Dynamics CRM
3 7 (0.82%) Oracle Procure-to-Pay
4 5 (0.59%) Oracle Assets
4 5 (0.59%) Oracle Cash Management
4 5 (0.59%) Oracle General Ledger
4 5 (0.59%) Oracle Payables
4 5 (0.59%) Oracle Receivables
5 4 (0.47%) Oracle ERP
5 4 (0.47%) SAP BPC
5 4 (0.47%) Sparx Enterprise Architect
5 4 (0.47%) Workday HCM
6 3 (0.35%) NetSuite
6 3 (0.35%) Oracle Financials
6 3 (0.35%) SAP CX
7 2 (0.23%) Aladdin
7 2 (0.23%) Endur
7 2 (0.23%) IBM Planning Analytics
7 2 (0.23%) SAP ERP
7 2 (0.23%) SAP MDG
Cloud Services
1 114 (13.36%) Azure
2 86 (10.08%) Power Platform
3 80 (9.38%) AWS
4 40 (4.69%) SaaS
5 28 (3.28%) Azure DevOps
6 23 (2.70%) GCP
7 21 (2.46%) Dynamics 365
8 18 (2.11%) Amazon S3
9 17 (1.99%) GitHub
9 17 (1.99%) Snowflake
10 16 (1.88%) Serverless
11 14 (1.64%) AWS Lambda
12 13 (1.52%) Datadog
12 13 (1.52%) dbt
13 10 (1.17%) Amazon SageMaker
13 10 (1.17%) AWS CloudFormation
13 10 (1.17%) Power Automate
14 9 (1.06%) Azure Data Factory
14 9 (1.06%) Microsoft 365
15 8 (0.94%) AWS Step Functions
Communications & Networking
1 17 (1.99%) LAN
2 13 (1.52%) Firewall
3 12 (1.41%) Ethernet
4 11 (1.29%) Modbus
5 9 (1.06%) WAN
6 8 (0.94%) Internet
7 7 (0.82%) 5G
7 7 (0.82%) DNS
7 7 (0.82%) Profibus
8 6 (0.70%) CHAP
8 6 (0.70%) Ethernet VPN
8 6 (0.70%) SD-WAN
8 6 (0.70%) TCP/IP
9 5 (0.59%) BGP
9 5 (0.59%) Network Security
9 5 (0.59%) NX-OS
9 5 (0.59%) OSPF
10 4 (0.47%) DHCP
10 4 (0.47%) MPLS
10 4 (0.47%) VLAN
Database & Business Intelligence
1 80 (9.38%) Power BI
2 43 (5.04%) Tableau
3 34 (3.99%) Data Warehouse
4 23 (2.70%) Metadata
4 23 (2.70%) SQL Server
5 19 (2.23%) BigQuery
6 15 (1.76%) Relational Database
7 13 (1.52%) Big Data
8 12 (1.41%) NoSQL
9 11 (1.29%) Data Lake
9 11 (1.29%) PostgreSQL
10 8 (0.94%) Amazon Redshift
11 7 (0.82%) Amazon Athena
11 7 (0.82%) Amazon Aurora
11 7 (0.82%) MongoDB
12 6 (0.70%) BusinessObjects
12 6 (0.70%) GIS
12 6 (0.70%) Looker
12 6 (0.70%) SAP HANA
12 6 (0.70%) SQL Server Reporting Services
Development Applications
1 76 (8.91%) JIRA
2 44 (5.16%) Git
3 39 (4.57%) Rational DOORS
4 26 (3.05%) Jenkins
5 20 (2.34%) Postman
6 15 (1.76%) Selenium
7 12 (1.41%) GitLab
7 12 (1.41%) JMeter
8 11 (1.29%) Cucumber
9 10 (1.17%) SoapUI
10 7 (0.82%) Cypress.io
10 7 (0.82%) LoadRunner
10 7 (0.82%) Locust
10 7 (0.82%) MLflow
11 6 (0.70%) TestRail
12 5 (0.59%) TestNG
12 5 (0.59%) Zephyr
13 4 (0.47%) SonarQube
13 4 (0.47%) WebDriver
13 4 (0.47%) webpack
General
1 327 (38.34%) Social Skills
2 250 (29.31%) Finance
3 170 (19.93%) Analytical Skills
4 61 (7.15%) Law
5 57 (6.68%) Manufacturing
6 52 (6.10%) Electronics
7 51 (5.98%) Documentation Skills
8 47 (5.51%) Marketing
9 42 (4.92%) Banking
10 40 (4.69%) Presentation Skills
11 37 (4.34%) Retail
12 36 (4.22%) Aerospace
13 33 (3.87%) Organisational Skills
14 31 (3.63%) Financial Institution
14 31 (3.63%) Inclusion and Diversity
15 28 (3.28%) Telecoms
16 27 (3.17%) Influencing Skills
17 25 (2.93%) Public Sector
18 23 (2.70%) Pharmaceutical
19 22 (2.58%) Billing
Job Titles
1 125 (14.65%) Senior
2 123 (14.42%) Analyst
3 101 (11.84%) Lead
4 67 (7.85%) Systems Engineer
5 42 (4.92%) Data Analyst
6 40 (4.69%) Business Analyst
7 35 (4.10%) Architect
7 35 (4.10%) Data Engineer
8 32 (3.75%) Support Engineer
9 31 (3.63%) Test Engineer
10 28 (3.28%) Applications Engineer
10 28 (3.28%) Developer
11 26 (3.05%) Applications Support
11 26 (3.05%) Principal Engineer
12 24 (2.81%) Administrator
13 23 (2.70%) Data Quality Analyst
13 23 (2.70%) Quality Analyst
13 23 (2.70%) Team Leader
14 22 (2.58%) Applications Support Engineer
15 19 (2.23%) Hardware Engineer
Libraries, Frameworks & Software Standards
1 27 (3.17%) REST
2 23 (2.70%) Middleware
3 21 (2.46%) JSON
3 21 (2.46%) XML
4 17 (1.99%) Kafka
4 17 (1.99%) scikit-learn
5 16 (1.88%) Pandas
6 15 (1.76%) PyTorch
6 15 (1.76%) TensorFlow
7 13 (1.52%) React
8 11 (1.29%) HTML
9 9 (1.06%) PySpark
10 8 (0.94%) CSS
10 8 (0.94%) Playwright
10 8 (0.94%) Web Services
11 7 (0.82%) Gherkin
11 7 (0.82%) NumPy
11 7 (0.82%) pytest
12 6 (0.70%) Hugging Face
12 6 (0.70%) Spring Boot
Miscellaneous
1 71 (8.32%) Management Information System
2 40 (4.69%) Life Science
3 39 (4.57%) Onboarding
4 35 (4.10%) Self-Motivation
5 34 (3.99%) Product Ownership
6 28 (3.28%) Algorithms
7 27 (3.17%) Operational Technology
8 19 (2.23%) SCADA
9 16 (1.88%) Foreign Exchange (FX)
10 13 (1.52%) Analytical Mindset
11 12 (1.41%) Credit Risk
11 12 (1.41%) Data Structures
11 12 (1.41%) FPGA
11 12 (1.41%) Legacy Systems
12 11 (1.29%) Data Centre
12 11 (1.29%) Embedded Systems
12 11 (1.29%) SWIFT Messaging Network
13 10 (1.17%) Low-Code
14 9 (1.06%) IoT
14 9 (1.06%) Virtual Team
Operating Systems
1 35 (4.10%) Linux
2 33 (3.87%) Windows
3 13 (1.52%) Windows Server
4 7 (0.82%) Windows Server 2016
5 5 (0.59%) Windows 10
5 5 (0.59%) Windows Server 2019
6 3 (0.35%) Unix
7 2 (0.23%) FreeRTOS
7 2 (0.23%) Mac OS
8 1 (0.12%) AIX
8 1 (0.12%) Android
8 1 (0.12%) Apple iOS
8 1 (0.12%) Red Hat Enterprise Linux
8 1 (0.12%) VMS
8 1 (0.12%) VxWorks
Processes & Methodologies
1 231 (27.08%) Agile
2 217 (25.44%) Problem-Solving
3 128 (15.01%) Verification and Validation
4 123 (14.42%) Data Validation
5 120 (14.07%) Migration
6 118 (13.83%) Continuous Improvement
7 104 (12.19%) Analytics
8 96 (11.25%) Test Automation
9 93 (10.90%) Decision-Making
10 91 (10.67%) Business Intelligence
10 91 (10.67%) Systems Engineering
11 89 (10.43%) Mentoring
12 86 (10.08%) Data Analysis
13 84 (9.85%) DevOps
14 83 (9.73%) CI/CD
14 83 (9.73%) Software Engineering
15 82 (9.61%) Data Management
15 82 (9.61%) ETL
16 76 (8.91%) Stakeholder Management
17 72 (8.44%) Roadmaps
Programming Languages
1 184 (21.57%) Python
2 177 (20.75%) SQL
3 38 (4.45%) Java
4 35 (4.10%) C
4 35 (4.10%) C++
4 35 (4.10%) MATLAB
5 22 (2.58%) JavaScript
6 17 (1.99%) PowerShell
7 14 (1.64%) R
8 11 (1.29%) Bash
8 11 (1.29%) T-SQL
8 11 (1.29%) TypeScript
9 7 (0.82%) Ladder Logic
10 6 (0.70%) C#
11 5 (0.59%) Scala
12 3 (0.35%) Bicep
12 3 (0.35%) Embedded C
12 3 (0.35%) Go
12 3 (0.35%) Google Apps Script
12 3 (0.35%) Kotlin
Qualifications
1 273 (32.00%) Degree
2 87 (10.20%) BPSS Clearance
3 83 (9.73%) Security Cleared
4 61 (7.15%) Master's Degree
5 51 (5.98%) SC Cleared
6 39 (4.57%) Computer Science Degree
7 26 (3.05%) Cisco Certification
8 20 (2.34%) HNC
9 16 (1.88%) DV Cleared
10 15 (1.76%) Microsoft Certification
11 14 (1.64%) CCNA
11 14 (1.64%) CCNP
12 13 (1.52%) ACCA
13 12 (1.41%) CCIE
13 12 (1.41%) PhD
14 11 (1.29%) ISTQB
14 11 (1.29%) Numerate Degree
15 10 (1.17%) Network+ Certification
16 9 (1.06%) CIMA
16 9 (1.06%) CISA
Quality Assurance & Compliance
1 113 (13.25%) Data Quality
2 110 (12.90%) QA
3 40 (4.69%) GxP
4 39 (4.57%) ISO/IEC 15288
5 30 (3.52%) SLA
6 28 (3.28%) Accessibility
7 26 (3.05%) GDPR
8 14 (1.64%) ISO/IEC 12207
9 11 (1.29%) ISO 20022
9 11 (1.29%) NIST
9 11 (1.29%) SEPA
10 9 (1.06%) Sarbanes-Oxley
11 8 (0.94%) 21 CFR Part 11
12 7 (0.82%) COBIT
12 7 (0.82%) TARGET2
12 7 (0.82%) WCAG
13 5 (0.59%) ARP4761
13 5 (0.59%) ISO/IEC 27001
14 4 (0.47%) NCSC
15 3 (0.35%) AUTOSAR
System Software
1 42 (4.92%) Docker
2 30 (3.52%) VMware Infrastructure
3 27 (3.17%) Firmware
4 13 (1.52%) Active Directory
5 12 (1.41%) Embedded Firmware
6 6 (0.70%) Virtual Machines
6 6 (0.70%) VMware ESXi
6 6 (0.70%) vSphere
7 5 (0.59%) vCloud
8 2 (0.23%) Apache Flume
8 2 (0.23%) Ceph
8 2 (0.23%) HDFS
8 2 (0.23%) Lustre
8 2 (0.23%) Microsoft Virtual Server
8 2 (0.23%) Slurm Workload Manager
8 2 (0.23%) Virtual Servers
9 1 (0.12%) Dovecot
9 1 (0.12%) Hyper-V
9 1 (0.12%) pfSense
9 1 (0.12%) Virtual Desktop
Systems Management
1 30 (3.52%) Kubernetes
2 22 (2.58%) Terraform
3 20 (2.34%) Grafana
4 16 (1.88%) Ansible
5 10 (1.17%) Prometheus
6 5 (0.59%) Docker Swarm
6 5 (0.59%) Kubeflow
6 5 (0.59%) vCenter Server
7 4 (0.47%) Rundeck
8 3 (0.35%) Kibana
9 2 (0.23%) Functional Safety
9 2 (0.23%) logstash
9 2 (0.23%) Microsoft Intune
9 2 (0.23%) Nessus
9 2 (0.23%) Oozie
9 2 (0.23%) Progress Chef
10 1 (0.12%) Control-M
10 1 (0.12%) Puppet
10 1 (0.12%) yum
10 1 (0.12%) ZABBIX
Vendors
1 95 (11.14%) Microsoft
2 59 (6.92%) SAP
3 36 (4.22%) VMware
4 27 (3.17%) Cisco
4 27 (3.17%) Oracle
5 22 (2.58%) Salesforce
6 19 (2.23%) IBM
7 14 (1.64%) Foundry
8 13 (1.52%) CheckPoint
8 13 (1.52%) F5
8 13 (1.52%) MathWorks
8 13 (1.52%) Siemens
9 10 (1.17%) Allen-Bradley
10 9 (1.06%) Databricks
10 9 (1.06%) Software AG
11 8 (0.94%) Intapp
11 8 (0.94%) Workday
12 7 (0.82%) EMC
12 7 (0.82%) Informatica
12 7 (0.82%) Rockwell