Hybrid/Remote Performance Tuning Contract Job Trends

Performance Tuning
UK > Work from Home

The table below provides summary statistics and contractor rates for remote or hybrid contract work requiring Performance Tuning skills. It covers contract job vacancies from the 6 months leading up to 19 November 2025, with comparisons to the same periods in the previous two years.

6 months to
19 Nov 2025
Same period 2024 Same period 2023
Rank 118 162 251
Rank change year-on-year +44 +89 +29
Contract jobs citing Performance Tuning 240 163 146
As % of all contract jobs with remote/hybrid work options 2.34% 1.35% 0.80%
As % of the Processes & Methodologies category 2.55% 1.53% 0.90%
Number of daily rates quoted 146 90 102
10th Percentile £369 £382 £363
25th Percentile £442 £407 £413
Median daily rate (50th Percentile) £500 £474 £475
Median % change year-on-year +5.54% -0.26% -13.64%
75th Percentile £600 £600 £537
90th Percentile £706 £663 £600
UK median daily rate £500 £525 £500
% change year-on-year -4.76% +5.00% -9.09%
Number of hourly rates quoted 2 1 4
10th Percentile £46.63 - -
25th Percentile £50.94 £62.50 £60.00
Median hourly rate £61.25 £75.00 £63.75
Median % change year-on-year -18.33% +17.65% -
75th Percentile £70.94 £87.50 £69.06
90th Percentile £74.88 - £69.63
UK median hourly rate £74.63 £61.60 £60.00
% change year-on-year +21.15% +2.67% -

All Process and Methodology Skills
Work from Home

Performance Tuning falls under the Processes and Methodologies category. For comparison with the information above, the following table provides summary statistics for all contract job vacancies with remote or hybrid options requiring process or methodology skills.

Contract vacancies with a requirement for process or methodology skills 9,404 10,648 16,215
As % of all contract jobs with a WFH option 91.67% 87.96% 88.81%
Number of daily rates quoted 6,235 6,639 11,258
10th Percentile £325 £325 £338
25th Percentile £413 £413 £425
Median daily rate (50th Percentile) £513 £525 £525
Median % change year-on-year -2.38% - -4.55%
75th Percentile £625 £638 £639
90th Percentile £725 £750 £740
UK median daily rate £500 £525 £530
% change year-on-year -4.76% -0.94% -3.64%
Number of hourly rates quoted 337 210 398
10th Percentile £15.18 £17.50 £19.25
25th Percentile £20.50 £22.13 £26.24
Median hourly rate £40.00 £38.75 £52.50
Median % change year-on-year +3.23% -26.19% -
75th Percentile £65.00 £65.75 £70.00
90th Percentile £68.75 £75.00 £86.50
UK median hourly rate £25.15 £35.00 £44.50
% change year-on-year -28.14% -21.35% +27.14%

Performance Tuning
Job Vacancy Trend for Remote/Hybrid Jobs

Historical trend showing the proportion of contract IT job postings citing Performance Tuning and offering remote or hybrid work options relative to all contract IT jobs advertised.
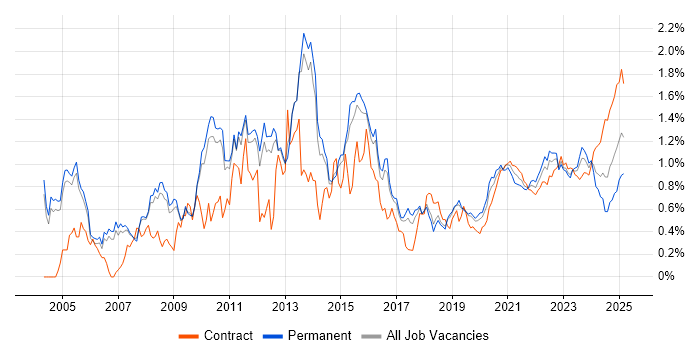
Performance Tuning job vacancy trend for remote/hybrid jobs

Performance Tuning
Daily Rate Trend for Remote/Hybrid Jobs

Contractor daily rate distribution trend for jobs with remote/hybrid work options citing Performance Tuning.

Contractor daily rate distribution trend for jobs with remote/hybrid work options citing Performance Tuning

Performance Tuning
Daily Rate Histogram for Remote/Hybrid Jobs

Daily rate distribution for jobs with remote/hybrid work options citing Performance Tuning over the 6 months to 19 November 2025.

Performance Tuning daily rate histogram for jobs with remote/hybrid work options

Performance Tuning
Hourly Rate Trend for Remote/Hybrid Jobs

Contractor hourly rate distribution trend for jobs with remote/hybrid work options citing Performance Tuning.

Contractor hourly rate distribution trend for jobs with remote/hybrid work options citing Performance Tuning

Performance Tuning
Hourly Rate Histogram for Remote/Hybrid Jobs

Hourly rate distribution for jobs with remote working options citing Performance Tuning over the 6 months to 19 November 2025.

Performance Tuning hourly rate histogram for jobs with remote/hybrid working options

Performance Tuning
Co-Occurring Skills & Capabilities in Remote/Hybrid Jobs by Category

The following tables expand on the one above by listing co-occurrences grouped by category. They cover the same employment type, locality and period, with up to 20 co-occurrences shown in each category:

Application Platforms
1 17 (7.08%) Apache Airflow
2 11 (4.58%) Apache Spark
3 8 (3.33%) Apache
4 5 (2.08%) CICS
5 4 (1.67%) Confluence
6 3 (1.25%) SAS
7 2 (0.83%) ArcGIS
7 2 (0.83%) Microsoft Exchange
7 2 (0.83%) SharePoint
8 1 (0.42%) Alfresco
8 1 (0.42%) Apache Solr
8 1 (0.42%) CMS
8 1 (0.42%) IIS
8 1 (0.42%) MQSeries
8 1 (0.42%) nginx
8 1 (0.42%) Oracle Workflow
8 1 (0.42%) SugarCRM
8 1 (0.42%) Umbraco
8 1 (0.42%) WebLogic
8 1 (0.42%) WebSphere
Applications
1 2 (0.83%) Microsoft Excel
1 2 (0.83%) Microsoft PowerPoint
2 1 (0.42%) Microsoft Office
2 1 (0.42%) Mozilla Thunderbird
2 1 (0.42%) Oracle Smart View
Business Applications
1 12 (5.00%) SAP S/4HANA
2 4 (1.67%) SAP MDG
2 4 (1.67%) SAP PLM
2 4 (1.67%) SAP VC
3 2 (0.83%) Dynamics AX
3 2 (0.83%) Dynamics CRM
3 2 (0.83%) Oracle EBS R12
3 2 (0.83%) SAP SD
4 1 (0.42%) Dynamics NAV
4 1 (0.42%) Magento
4 1 (0.42%) Oracle EBS
4 1 (0.42%) SAP FI
4 1 (0.42%) Shopify
4 1 (0.42%) Teamcenter
Cloud Services
1 76 (31.67%) Azure
2 68 (28.33%) AWS
3 18 (7.50%) GitHub
4 17 (7.08%) Azure DevOps
5 16 (6.67%) Snowflake
6 15 (6.25%) GCP
6 15 (6.25%) Power Platform
7 14 (5.83%) Amazon S3
7 14 (5.83%) GitHub Actions
8 12 (5.00%) dbt
8 12 (5.00%) Serverless
9 11 (4.58%) Amazon CloudWatch
10 10 (4.17%) Amazon EC2
11 9 (3.75%) Azure Data Factory
11 9 (3.75%) Datadog
12 7 (2.92%) Amazon ECS
12 7 (2.92%) AWS CloudFormation
12 7 (2.92%) Azure Synapse Analytics
12 7 (2.92%) Dynamics 365
12 7 (2.92%) Virtual Private Cloud
Communications & Networking
1 8 (3.33%) Firewall
2 6 (2.50%) TCP/IP
3 5 (2.08%) HTTP
4 4 (1.67%) DNS
4 4 (1.67%) SSL
5 3 (1.25%) Internet
6 2 (0.83%) DHCP
6 2 (0.83%) Network Security
6 2 (0.83%) Unified Communications
6 2 (0.83%) VPN
6 2 (0.83%) WebEx
7 1 (0.42%) Cisco Nexus
7 1 (0.42%) Ethernet VPN
7 1 (0.42%) F5 BIG-IP LTM
7 1 (0.42%) Multicast
7 1 (0.42%) NX-OS
7 1 (0.42%) OpenLDAP
7 1 (0.42%) Remote Desktop
7 1 (0.42%) SD-WAN
7 1 (0.42%) VXLAN
Database & Business Intelligence
1 39 (16.25%) MongoDB
2 38 (15.83%) DB2
2 38 (15.83%) Relational Database
3 31 (12.92%) SQL Server
4 25 (10.42%) Data Warehouse
5 24 (10.00%) PostgreSQL
6 16 (6.67%) Oracle Database
7 14 (5.83%) Power BI
8 12 (5.00%) Azure SQL Database
9 11 (4.58%) Amazon RDS
9 11 (4.58%) MySQL
10 10 (4.17%) Data Lake
11 8 (3.33%) Big Data
11 8 (3.33%) NoSQL
12 7 (2.92%) Amazon Aurora
12 7 (2.92%) Hadoop
12 7 (2.92%) Oracle Reports
12 7 (2.92%) Snowflake Schema
13 5 (2.08%) Elasticsearch
13 5 (2.08%) Oracle BI Publisher
Development Applications
1 37 (15.42%) JUnit
2 27 (11.25%) Git
3 16 (6.67%) Jenkins
4 8 (3.33%) GitLab
5 6 (2.50%) Cypress.io
5 6 (2.50%) JIRA
6 3 (1.25%) Maven
7 2 (0.83%) GCC
7 2 (0.83%) LSMW
7 2 (0.83%) SQL Server Management Studio (SSMS)
7 2 (0.83%) Visual Studio
8 1 (0.42%) Bitbucket
8 1 (0.42%) Cucumber
8 1 (0.42%) IntelliJ
8 1 (0.42%) Jasmine
8 1 (0.42%) JMeter
8 1 (0.42%) LoadRunner
8 1 (0.42%) Oracle Forms
8 1 (0.42%) SoapUI
8 1 (0.42%) Vagrant
General
1 99 (41.25%) Social Skills
2 73 (30.42%) Finance
3 56 (23.33%) Analytical Skills
4 50 (20.83%) Banking
5 35 (14.58%) Investment Banking
6 22 (9.17%) Public Sector
7 17 (7.08%) Front Office
8 10 (4.17%) Inclusion and Diversity
9 7 (2.92%) Manufacturing
10 6 (2.50%) Pharmaceutical
11 5 (2.08%) Marketing
12 3 (1.25%) German Language
12 3 (1.25%) Legal
12 3 (1.25%) Presentation Skills
13 2 (0.83%) Automotive
13 2 (0.83%) Documentation Skills
13 2 (0.83%) Electronics
13 2 (0.83%) Retail
13 2 (0.83%) Telecoms
14 1 (0.42%) Billing
Job Titles
1 83 (34.58%) Developer
2 44 (18.33%) Java Developer
3 35 (14.58%) SQL Developer
4 34 (14.17%) Investment Banking Java Developer
4 34 (14.17%) Senior
5 25 (10.42%) Data Engineer
5 25 (10.42%) Senior Developer
6 22 (9.17%) Consultant
7 20 (8.33%) DBA
8 19 (7.92%) Lead
9 18 (7.50%) Senior Java Developer
10 17 (7.08%) Senior SQL Developer
11 15 (6.25%) Linux Developer
11 15 (6.25%) Senior Investment Banking Java Developer
11 15 (6.25%) Sybase Developer
12 14 (5.83%) Architect
13 12 (5.00%) Administrator
14 9 (3.75%) SAP Consultant
15 8 (3.33%) Java Engineer
16 7 (2.92%) AWS Engineer
Libraries, Frameworks & Software Standards
1 48 (20.00%) Kafka
2 46 (19.17%) Spring
3 31 (12.92%) JMS
4 22 (9.17%) RESTful
5 15 (6.25%) REST
6 14 (5.83%) Spring Boot
7 11 (4.58%) React
8 9 (3.75%) .NET
8 9 (3.75%) AngularJS
8 9 (3.75%) Elastic Stack
9 7 (2.92%) FIX Protocol
9 7 (2.92%) HTML
9 7 (2.92%) OAuth
9 7 (2.92%) Oracle GoldenGate
10 6 (2.50%) AWS CDK
10 6 (2.50%) CSS
10 6 (2.50%) Web Services
11 5 (2.08%) OAuth2
11 5 (2.08%) SAP Fiori
11 5 (2.08%) SOAP
Miscellaneous
1 38 (15.83%) Data Structures
2 30 (12.50%) Equities
3 21 (8.75%) Replication
4 17 (7.08%) Distributed Systems
5 15 (6.25%) Clustering
6 14 (5.83%) Cloud Native
7 12 (5.00%) Mainframe
8 10 (4.17%) Legacy Systems
9 7 (2.92%) Distributed Computing
9 7 (2.92%) Foreign Exchange (FX)
10 6 (2.50%) Analytical Mindset
11 5 (2.08%) Data Protection Act
12 4 (1.67%) Algorithms
12 4 (1.67%) Onboarding
12 4 (1.67%) Product Ownership
13 3 (1.25%) Legacy Code
13 3 (1.25%) Linux Command Line
13 3 (1.25%) Renewable Energy
14 2 (0.83%) Greenfield Project
14 2 (0.83%) Legacy Applications
Operating Systems
1 67 (27.92%) Linux
2 13 (5.42%) Windows
3 8 (3.33%) zOS
4 6 (2.50%) Windows Server
5 5 (2.08%) Unix
6 3 (1.25%) AIX
6 3 (1.25%) Red Hat Enterprise Linux
6 3 (1.25%) VMS
7 2 (0.83%) OS/2
7 2 (0.83%) Ubuntu
8 1 (0.42%) Amazon Linux
8 1 (0.42%) CentOS
8 1 (0.42%) Windows Server 2012
Processes & Methodologies
1 78 (32.50%) Problem-Solving
2 72 (30.00%) DevOps
3 71 (29.58%) CI/CD
4 69 (28.75%) Agile
5 43 (17.92%) Data Modelling
6 38 (15.83%) Database Tuning
7 36 (15.00%) Migration
8 34 (14.17%) Multithreading
9 32 (13.33%) Infrastructure as Code
9 32 (13.33%) Open Source
9 32 (13.33%) SDLC
10 31 (12.92%) Data Pipeline
11 30 (12.50%) Analytics
12 29 (12.08%) ETL
13 27 (11.25%) Business Intelligence
14 25 (10.42%) Containerisation
15 23 (9.58%) Continuous Improvement
15 23 (9.58%) High Availability
15 23 (9.58%) Microservices
16 22 (9.17%) Observability
Programming Languages
1 102 (42.50%) SQL
2 81 (33.75%) Python
3 72 (30.00%) Java
4 31 (12.92%) Shell Script
5 12 (5.00%) PowerShell
6 11 (4.58%) ABAP
6 11 (4.58%) C#
7 10 (4.17%) JavaScript
7 10 (4.17%) PL/SQL
8 7 (2.92%) Perl
9 6 (2.50%) Bash
9 6 (2.50%) REXX
10 5 (2.08%) JCL
10 5 (2.08%) T-SQL
10 5 (2.08%) TypeScript
11 4 (1.67%) Assembly Language
11 4 (1.67%) CLIST
12 3 (1.25%) Korn
12 3 (1.25%) PL/1
12 3 (1.25%) Scala
Qualifications
1 31 (12.92%) Security Cleared
2 27 (11.25%) SC Cleared
3 17 (7.08%) Degree
4 7 (2.92%) BPSS Clearance
5 6 (2.50%) Azure Certification
6 5 (2.08%) Computer Science Degree
7 3 (1.25%) AWS Certification
7 3 (1.25%) OCP
7 3 (1.25%) Oracle Certification
8 2 (0.83%) ITIL Certification
8 2 (0.83%) Microsoft Certification
8 2 (0.83%) OCA
8 2 (0.83%) VCAP
8 2 (0.83%) VMware Certified Professional (VCP)
9 1 (0.42%) BC Cleared
9 1 (0.42%) CompTIA Security+
9 1 (0.42%) DBS Check
9 1 (0.42%) DV Cleared
9 1 (0.42%) RHCE
9 1 (0.42%) RHCSA
Quality Assurance & Compliance
1 21 (8.75%) QA
2 19 (7.92%) Data Quality
3 9 (3.75%) GDPR
4 8 (3.33%) Accessibility
5 6 (2.50%) PCI DSS
6 5 (2.08%) Sarbanes-Oxley
7 4 (1.67%) HIPAA
7 4 (1.67%) ISO/IEC 27001
7 4 (1.67%) SLA
8 2 (0.83%) HL7
9 1 (0.42%) Actionable Recommendations
9 1 (0.42%) COBIT
9 1 (0.42%) Government Security Classifications
9 1 (0.42%) JSP 440
9 1 (0.42%) NCSC
9 1 (0.42%) NIST
System Software
1 35 (14.58%) Docker
2 10 (4.17%) Active Directory
3 7 (2.92%) VMware Infrastructure
4 6 (2.50%) Oracle RAC
4 6 (2.50%) RACF
5 5 (2.08%) Job Entry Subsystem
6 4 (1.67%) NDS
6 4 (1.67%) NetIQ eDirectory
7 3 (1.25%) Time Sharing Option
7 3 (1.25%) Virtual Machines
7 3 (1.25%) VMware ESXi
8 2 (0.83%) HDFS
8 2 (0.83%) NFS
8 2 (0.83%) vSphere
9 1 (0.42%) Dovecot
9 1 (0.42%) GPFS
9 1 (0.42%) Hyper-V
9 1 (0.42%) KVM
9 1 (0.42%) Squid
9 1 (0.42%) Tivoli Workload Scheduler
Systems Management
1 33 (13.75%) Terraform
2 23 (9.58%) Kubernetes
3 16 (6.67%) Ansible
4 8 (3.33%) Prometheus
5 6 (2.50%) Data Guard
5 6 (2.50%) ITRS Geneos
6 5 (2.08%) Oracle RMAN
6 5 (2.08%) Progress Chef
6 5 (2.08%) Single Sign-On
7 4 (1.67%) Grafana
7 4 (1.67%) Kibana
7 4 (1.67%) logstash
8 3 (1.25%) Oracle Enterprise Manager
8 3 (1.25%) Puppet
9 2 (0.83%) Cisco CUCM
9 2 (0.83%) Hadoop YARN
9 2 (0.83%) NetBackup
9 2 (0.83%) OMEGAMON
9 2 (0.83%) Oozie
9 2 (0.83%) Tivoli NetView
Vendors
1 31 (12.92%) Sybase
2 30 (12.50%) Oracle
3 21 (8.75%) Microsoft
4 16 (6.67%) SAP
5 13 (5.42%) Databricks
6 9 (3.75%) IBM
7 7 (2.92%) ServiceNow
7 7 (2.92%) VMware
8 6 (2.50%) Solace
9 5 (2.08%) Informatica
9 5 (2.08%) Red Hat
10 4 (1.67%) Bloomberg
10 4 (1.67%) Google
10 4 (1.67%) NetIQ
10 4 (1.67%) Okta
10 4 (1.67%) Refinitiv
11 3 (1.25%) Broadcom
11 3 (1.25%) OpenText
11 3 (1.25%) Teradata
11 3 (1.25%) Zscaler