Business Analysis Jobs

Business Analysis
UK

The table below provides summary statistics for permanent job vacancies requiring Business Analysis skills. It includes a benchmarking guide to the annual salaries offered in vacancies that cited Business Analysis over the 6 months leading up to 31 October 2024, comparing them to the same period in the previous two years.

6 months to
31 Oct 2024
Same period 2023 Same period 2022
Rank 226 143 139
Rank change year-on-year -83 -4 +35
Permanent jobs citing Business Analysis 897 1,395 3,798
As % of all permanent jobs advertised in the UK 1.18% 2.42% 2.74%
As % of the Processes & Methodologies category 1.40% 2.57% 2.85%
Number of salaries quoted 539 958 2,494
10th Percentile £36,250 £39,091 £39,333
25th Percentile £45,000 £48,750 £46,311
Median annual salary (50th Percentile) £60,000 £62,500 £59,000
Median % change year-on-year -4.00% +5.93% +7.27%
75th Percentile £77,500 £76,250 £73,750
90th Percentile £97,750 £90,000 £87,500
UK excluding London median annual salary £50,000 £50,000 £51,953
% change year-on-year - -3.76% +9.37%

All Process and Methodology Skills
UK

Business Analysis falls under the Processes and Methodologies category. For comparison with the information above, the following table provides summary statistics for all permanent job vacancies requiring process or methodology skills.

Permanent vacancies with a requirement for process or methodology skills 63,881 54,318 133,368
As % of all permanent jobs advertised in the UK 84.08% 94.30% 96.11%
Number of salaries quoted 30,489 39,141 76,332
10th Percentile £34,000 £32,500 £34,000
25th Percentile £45,000 £44,000 £45,000
Median annual salary (50th Percentile) £60,000 £60,000 £60,000
Median % change year-on-year - - +4.35%
75th Percentile £78,000 £80,000 £81,250
90th Percentile £96,250 £97,500 £98,750
UK excluding London median annual salary £54,439 £52,500 £52,500
% change year-on-year +3.69% - +5.00%

Business Analysis
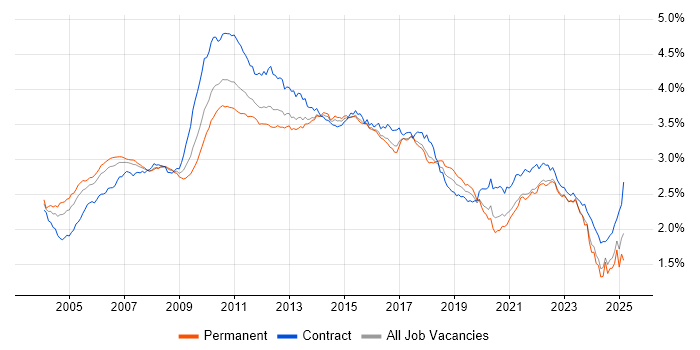
Job Vacancy Trend

Job postings citing Business Analysis as a proportion of all IT jobs advertised.

Job vacancy trend for Business Analysis in the UK

Business Analysis
Salary Trend

3-month moving average salary quoted in jobs citing Business Analysis.

Salary trend for Business Analysis in the UK

Business Analysis
Salary Histogram

Salary distribution for jobs citing Business Analysis over the 6 months to 31 October 2024.

Salary histogram for Business Analysis in the UK

Business Analysis
Top 17 Job Locations

The table below looks at the demand and provides a guide to the median salaries quoted in IT jobs citing Business Analysis within the UK over the 6 months to 31 October 2024. The 'Rank Change' column provides an indication of the change in demand within each location based on the same 6 month period last year.

Location Rank Change
on Same Period
Last Year
Matching
Permanent
IT Job Ads
Median Salary
Past 6 Months
Median Salary
% Change
on Same Period
Last Year
Live
Jobs
England -80 847 £60,000 -4.00% 158
UK excluding London -51 542 £50,000 - 110
London -76 339 £71,750 +6.30% 54
Work from Home -42 336 £62,500 +4.17% 96
Midlands +1 179 £54,939 +12.12% 17
North of England -16 150 £43,500 -13.00% 34
East Midlands +21 98 £75,000 +50.03% 3
South East -64 85 £40,000 -27.27% 21
West Midlands -42 81 £52,500 +8.81% 14
North West -54 71 £52,500 +3.96% 19
South West -45 62 £52,500 -4.55% 13
North East +12 60 £37,500 -21.05% 6
Scotland -24 29 £40,500 -20.98% 7
East of England -52 27 £65,000 +44.44% 16
Yorkshire -17 19 £45,000 -10.00% 10
Wales +17 7 £47,500 -30.10% 2
Northern Ireland -15 5 £59,715 -11.53% 2

Business Analysis
Co-occurring Skills and Capabilities by Category

The follow tables expand on the table above by listing co-occurrences grouped by category. The same employment type, locality and period is covered with up to 20 co-occurrences shown in each of the following categories:

Application Platforms
1 40 (4.46%) Apache
2 22 (2.45%) SharePoint
3 16 (1.78%) Confluence
4 12 (1.34%) SAS
5 7 (0.78%) Apache Airflow
5 7 (0.78%) Apache Spark
6 5 (0.56%) CMS
7 4 (0.45%) ArcGIS
7 4 (0.45%) Microsoft Exchange
8 3 (0.33%) Apache Solr
8 3 (0.33%) nginx
8 3 (0.33%) OpenEdge
9 1 (0.11%) BizTalk Server
9 1 (0.11%) Sitecore CMS
Applications
1 90 (10.03%) Microsoft Excel
2 41 (4.57%) Microsoft Office
3 29 (3.23%) Microsoft PowerPoint
4 25 (2.79%) MS Visio
5 19 (2.12%) Microsoft Project
6 2 (0.22%) Chatbot
7 1 (0.11%) Trello
Business Applications
1 16 (1.78%) Aladdin
2 15 (1.67%) Dynamics CRM
3 8 (0.89%) Infor CloudSuite Industrial (formerly SyteLine)
3 8 (0.89%) Maximo
4 5 (0.56%) Sage 200
4 5 (0.56%) SAP WM
5 4 (0.45%) Eagle PACE
5 4 (0.45%) Elite 3E
5 4 (0.45%) Markit EDM
5 4 (0.45%) SAP HR
6 3 (0.33%) Fidessa
6 3 (0.33%) Magento
6 3 (0.33%) Payment Gateway
6 3 (0.33%) SAP CO
6 3 (0.33%) SAP FI
6 3 (0.33%) SAP FI/CO
6 3 (0.33%) SAP S/4HANA
7 2 (0.22%) iTrent
7 2 (0.22%) Shopify
7 2 (0.22%) Workday HCM
Cloud Services
1 138 (15.38%) Power Platform
2 73 (8.14%) AWS
3 67 (7.47%) Azure
4 42 (4.68%) dbt
5 23 (2.56%) Microsoft 365
6 21 (2.34%) Google Docs
6 21 (2.34%) Google Sheets
7 18 (2.01%) Dynamics 365
8 17 (1.90%) Azure DevOps
9 16 (1.78%) SaaS
10 9 (1.00%) GitHub
11 8 (0.89%) Azure Synapse Analytics
11 8 (0.89%) Power Automate
11 8 (0.89%) PowerApps
11 8 (0.89%) Serverless
12 6 (0.67%) Amazon S3
12 6 (0.67%) GCP
13 5 (0.56%) Amazon SQS
13 5 (0.56%) AWS Lambda
13 5 (0.56%) Miro
Communications & Networking
1 6 (0.67%) Firewall
2 5 (0.56%) RFID
3 3 (0.33%) Intranet
3 3 (0.33%) LAN
3 3 (0.33%) Multicast
3 3 (0.33%) WAN
4 1 (0.11%) SSH
4 1 (0.11%) TCP/IP
4 1 (0.11%) Wireless
Database & Business Intelligence
1 110 (12.26%) Power BI
2 94 (10.48%) Tableau
3 43 (4.79%) Data Lake
4 41 (4.57%) SQL Server
5 36 (4.01%) Apache Arrow
5 36 (4.01%) Dremio
6 32 (3.57%) Big Data
7 27 (3.01%) Data Warehouse
8 19 (2.12%) NoSQL
9 16 (1.78%) Data Mining
10 12 (1.34%) MySQL
10 12 (1.34%) SQL Server Reporting Services
11 11 (1.23%) MongoDB
12 9 (1.00%) Relational Database
13 6 (0.67%) Apache Hive
13 6 (0.67%) SQL Server Integration Services
14 5 (0.56%) Azure SQL Data Warehouse
14 5 (0.56%) Enterprise Data Warehouse
14 5 (0.56%) GIS
15 4 (0.45%) Azure SQL Database
Development Applications
1 49 (5.46%) JIRA
2 15 (1.67%) Git
3 13 (1.45%) Selenium
4 5 (0.56%) Bitbucket
4 5 (0.56%) Cucumber
4 5 (0.56%) Jenkins
5 4 (0.45%) Katalon Studio
6 3 (0.33%) Visual Studio
7 2 (0.22%) Postman
7 2 (0.22%) SoapUI
7 2 (0.22%) Subversion
8 1 (0.11%) ERwin
8 1 (0.11%) JUnit
8 1 (0.11%) Maven
8 1 (0.11%) SQL Server Management Studio (SSMS)
General
1 312 (34.78%) Social Skills
2 263 (29.32%) Finance
3 239 (26.64%) Analytical Skills
4 193 (21.52%) Retail
5 108 (12.04%) Legal
6 99 (11.04%) Banking
7 71 (7.92%) Front Office
8 65 (7.25%) Marketing
9 55 (6.13%) Investment Banking
10 46 (5.13%) Public Sector
11 42 (4.68%) Inclusion and Diversity
12 38 (4.24%) Law
13 37 (4.12%) Pharmaceutical
14 29 (3.23%) Organisational Skills
14 29 (3.23%) Presentation Skills
15 24 (2.68%) Manufacturing
16 22 (2.45%) Publishing
17 19 (2.12%) Automotive
18 17 (1.90%) Influencing Skills
19 13 (1.45%) Telecoms
Job Titles
1 543 (60.54%) Analyst
2 422 (47.05%) Business Analyst
3 100 (11.15%) Senior
4 95 (10.59%) Lead
5 81 (9.03%) IT Analyst
6 80 (8.92%) Business IT Analyst
6 80 (8.92%) IT Business Analyst
7 70 (7.80%) Senior Analyst
8 62 (6.91%) Lead Business Analyst
9 58 (6.47%) Architect
10 56 (6.24%) Senior Business Analyst
11 54 (6.02%) Consultant
12 41 (4.57%) Data Analyst
12 41 (4.57%) Solutions Architect
13 35 (3.90%) Team Leader
14 34 (3.79%) Business Analyst Team Leader
15 30 (3.34%) Developer
16 29 (3.23%) Data Business Analyst
17 25 (2.79%) Insurance Business Analyst
17 25 (2.79%) Product Manager
Libraries, Frameworks & Software Standards
1 18 (2.01%) HTML
2 16 (1.78%) .NET
2 16 (1.78%) SailPoint
3 13 (1.45%) CSS
3 13 (1.45%) React
4 12 (1.34%) REST
5 11 (1.23%) XML
6 9 (1.00%) NumPy
7 8 (0.89%) .NET Framework
7 8 (0.89%) Node.js
8 7 (0.78%) HTML5
9 6 (0.67%) .NET Core
9 6 (0.67%) GraphQL
9 6 (0.67%) JSON
9 6 (0.67%) Pandas
9 6 (0.67%) Redux
9 6 (0.67%) RESTful
9 6 (0.67%) Spring
10 5 (0.56%) FIX Protocol
10 5 (0.56%) Unity DI Container
Miscellaneous
1 101 (11.26%) Product Ownership
2 55 (6.13%) Derivative
2 55 (6.13%) Foreign Exchange (FX)
3 54 (6.02%) Hedge funds
4 52 (5.80%) Fixed Income
5 51 (5.69%) Equities
6 36 (4.01%) Analytical Mindset
6 36 (4.01%) NHS
7 30 (3.34%) Management Information System
8 29 (3.23%) FMCG
9 18 (2.01%) Reinsurance
10 14 (1.56%) Low-Code
10 14 (1.56%) Onboarding
10 14 (1.56%) Operational Technology
11 13 (1.45%) Data Structures
12 12 (1.34%) Algorithms
12 12 (1.34%) Reference Data
13 10 (1.11%) Data Protection Act
13 10 (1.11%) Enterprise Software
13 10 (1.11%) Self-Motivation
Operating Systems
1 26 (2.90%) Windows
2 21 (2.34%) Linux
3 8 (0.89%) Android
3 8 (0.89%) Apple iOS
3 8 (0.89%) Windows Server
4 3 (0.33%) CentOS
4 3 (0.33%) Unix
5 2 (0.22%) Windows Vista
Processes & Methodologies
1 298 (33.22%) Agile
2 162 (18.06%) Project Management
3 149 (16.61%) Problem-Solving
4 127 (14.16%) Stakeholder Management
5 125 (13.94%) ITIL
6 122 (13.60%) SDLC
7 117 (13.04%) Requirements Gathering
8 113 (12.60%) Analytics
8 113 (12.60%) Process Improvement
9 112 (12.49%) Business Case
10 111 (12.37%) Coaching
11 105 (11.71%) Business Intelligence
12 104 (11.59%) Logistics
13 102 (11.37%) Continuous Improvement
14 100 (11.15%) Project Delivery
15 99 (11.04%) Roadmaps
16 95 (10.59%) Decision-Making
16 95 (10.59%) Disaster Recovery
17 89 (9.92%) GAP Analysis
18 88 (9.81%) Requirements Analysis
Programming Languages
1 232 (25.86%) SQL
2 92 (10.26%) Python
3 27 (3.01%) Java
4 15 (1.67%) C#
5 14 (1.56%) JavaScript
6 11 (1.23%) VBA
7 10 (1.11%) PowerShell
7 10 (1.11%) R
8 8 (0.89%) T-SQL
9 7 (0.78%) Ruby
10 6 (0.67%) Shell Script
10 6 (0.67%) TypeScript
11 4 (0.45%) Data Analysis Expressions
11 4 (0.45%) Groovy
11 4 (0.45%) MATLAB
11 4 (0.45%) Scala
12 3 (0.33%) C++
12 3 (0.33%) PHP
12 3 (0.33%) VB
13 2 (0.22%) RPG
Qualifications
1 193 (21.52%) Degree
2 68 (7.58%) Security Cleared
3 43 (4.79%) SC Cleared
4 28 (3.12%) CBAP
5 27 (3.01%) BPSS Clearance
6 22 (2.45%) Master's Degree
7 15 (1.67%) IIBA
8 13 (1.45%) Computer Science Degree
8 13 (1.45%) DV Cleared
9 9 (1.00%) PMI Certification
10 8 (0.89%) MBA
10 8 (0.89%) PMP
11 7 (0.78%) ISEB
11 7 (0.78%) ITIL Certification
12 6 (0.67%) ITIL Foundation Certificate
12 6 (0.67%) Microsoft Certification
12 6 (0.67%) PRINCE2 Certification
13 4 (0.45%) CISSP
13 4 (0.45%) ISTQB
13 4 (0.45%) Numerate Degree
Quality Assurance & Compliance
1 128 (14.27%) QA
2 14 (1.56%) PMO
3 13 (1.45%) Data Quality
4 11 (1.23%) ISO/IEC 27001
5 10 (1.11%) EMIR
5 10 (1.11%) GDPR
5 10 (1.11%) SLA
6 9 (1.00%) Cyber Essentials
7 7 (0.78%) Accessibility
8 5 (0.56%) NIST
9 3 (0.33%) ISO 20022
9 3 (0.33%) SEPA
9 3 (0.33%) TARGET2
10 1 (0.11%) Cyber Essentials PLUS
10 1 (0.11%) MiFID
System Software
1 9 (1.00%) Virtual Machines
2 6 (0.67%) Docker
3 3 (0.33%) Active Directory
Systems Management
1 4 (0.45%) Microsoft Intune
1 4 (0.45%) Progress Chef
1 4 (0.45%) Puppet
1 4 (0.45%) SCCM
2 3 (0.33%) Kubernetes
3 1 (0.11%) Ansible
3 1 (0.11%) Single Sign-On
3 1 (0.11%) Terraform
Vendors
1 115 (12.82%) Microsoft
2 37 (4.12%) IFS
3 32 (3.57%) SAP
4 25 (2.79%) Bloomberg
4 25 (2.79%) Salesforce
5 23 (2.56%) Google
6 17 (1.90%) Oracle
7 16 (1.78%) CyberArk
7 16 (1.78%) ForgeRock
7 16 (1.78%) Ping Identity
8 12 (1.34%) BISAM
9 10 (1.11%) Pega
10 7 (0.78%) Reuters
11 6 (0.67%) IBM
11 6 (0.67%) Infor
11 6 (0.67%) Sage
12 5 (0.56%) Adobe
12 5 (0.56%) Capita
12 5 (0.56%) Murex
13 4 (0.45%) Cognos