IaaS Job Trends

Infrastructure as a Service (IaaS)
UK

The table below provides summary statistics and salary benchmarking for jobs requiring IaaS skills. It covers vacancies from the 6 months leading up to 17 September 2025, with comparisons to the same periods in the previous two years.

6 months to
17 Sep 2025
Same period 2024 Same period 2023
Rank 417 376 185
Rank change year-on-year -41 -191 +113
Permanent jobs citing IaaS 279 511 1,125
As % of all permanent jobs advertised in the UK 0.57% 0.66% 1.84%
As % of the Cloud Services category 1.79% 2.08% 4.36%
Number of salaries quoted 200 337 774
10th Percentile £37,170 £47,500 £46,250
25th Percentile £46,250 £50,000 £57,500
Median annual salary (50th Percentile) £60,250 £65,000 £72,500
Median % change year-on-year -7.31% -10.34% +7.41%
75th Percentile £78,750 £82,500 £85,000
90th Percentile £96,750 £102,500 £103,375
UK excluding London median annual salary £56,695 £60,000 £68,500
% change year-on-year -5.51% -12.41% +16.10%

All Cloud Skills
UK

IaaS falls under the Cloud Services category. For comparison with the information above, the following table provides summary statistics for all permanent job vacancies requiring cloud computing skills.

Permanent vacancies with a requirement for cloud computing skills 15,619 24,598 25,822
As % of all permanent jobs advertised in the UK 31.64% 31.59% 42.33%
Number of salaries quoted 10,569 15,688 21,510
10th Percentile £29,750 £34,500 £33,500
25th Percentile £39,377 £45,738 £46,250
Median annual salary (50th Percentile) £60,000 £62,500 £62,500
Median % change year-on-year -4.00% - -
75th Percentile £80,000 £82,500 £82,500
90th Percentile £100,550 £102,500 £100,000
UK excluding London median annual salary £50,000 £55,000 £55,000
% change year-on-year -9.09% - -

IaaS
Job Vacancy Trend

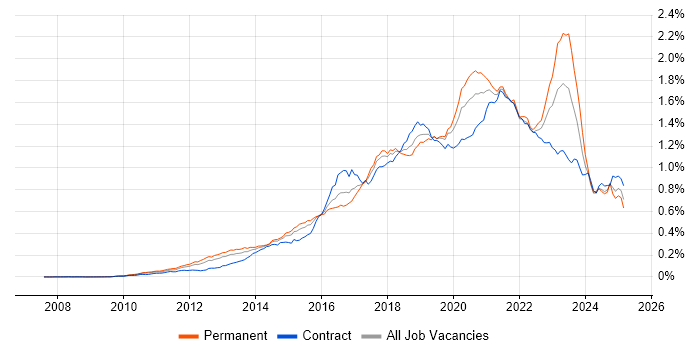
Job postings citing IaaS as a proportion of all IT jobs advertised.

Job vacancy trend for IaaS in the UK

IaaS
Salary Trend

Salary distribution trend for jobs in the UK citing IaaS.

Salary distribution trend for jobs in the UK citing IaaS

IaaS
Salary Histogram

Salary distribution for jobs citing IaaS over the 6 months to 17 September 2025.

Salary histogram for IaaS in the UK

IaaS
Top 17 Job Locations

The table below looks at the demand and provides a guide to the median salaries quoted in IT jobs citing IaaS within the UK over the 6 months to 17 September 2025. The 'Rank Change' column provides an indication of the change in demand within each location based on the same 6 month period last year.

Location Rank Change
on Same Period
Last Year
Matching
Permanent
IT Job Ads
Median Salary
Past 6 Months
Median Salary
% Change
on Same Period
Last Year
Live
Jobs
England -34 257 £61,000 -6.15% 103
UK excluding London +4 175 £56,695 -5.51% 84
Work from Home -2 113 £57,500 -8.00% 63
London -15 94 £70,000 -5.68% 47
North of England +38 49 £57,500 +15.00% 18
Midlands +41 39 £63,750 +6.25% 13
South East +2 35 £59,000 +2.61% 27
West Midlands +27 25 £60,000 - 6
North West +5 22 £49,000 -2.00% 10
South West +41 21 £47,500 -18.80% 4
Yorkshire +24 21 £47,500 -20.83% 4
East of England -7 15 £55,000 +10.00% 11
East Midlands +43 14 £75,000 +25.00% 7
Wales +20 8 £38,094 +1.58% 1
North East +22 6 £65,000 +49.43% 4
Scotland +35 4 £57,500 +4.55% 11
Northern Ireland - 3 £53,546 - 2

IaaS
Co-occurring Skills and Capabilities by Category

The follow tables expand on the table above by listing co-occurrences grouped by category. The same employment type, locality and period is covered with up to 20 co-occurrences shown in each of the following categories:

Application Platforms
1 30 (10.75%) Microsoft Exchange
2 24 (8.60%) SharePoint
3 7 (2.51%) IIS
4 2 (0.72%) Apache
4 2 (0.72%) BizTalk Server
Applications
1 2 (0.72%) Maya
2 1 (0.36%) AutoCAD
2 1 (0.36%) Autodesk Inventor
2 1 (0.36%) SOLIDWORKS
Business Applications
1 6 (2.15%) SAP FS
2 3 (1.08%) Shopify
3 2 (0.72%) Dynamics CRM
3 2 (0.72%) Dynamics GP
4 1 (0.36%) Oracle EBS
4 1 (0.36%) Oracle Payables
Cloud Services
1 219 (78.49%) PaaS
2 218 (78.14%) Azure
3 166 (59.50%) SaaS
4 88 (31.54%) Microsoft 365
5 80 (28.67%) AWS
6 52 (18.64%) Entra ID
7 46 (16.49%) Azure DevOps
8 33 (11.83%) Power Platform
9 30 (10.75%) Azure Monitor
9 30 (10.75%) Serverless
10 29 (10.39%) Azure Key Vault
11 25 (8.96%) Power Automate
12 24 (8.60%) GCP
13 20 (7.17%) Azure Service Bus
14 18 (6.45%) Azure ExpressRoute
15 16 (5.73%) Azure AI
16 15 (5.38%) Azure Functions
16 15 (5.38%) GitHub
17 12 (4.30%) Azure Logic Apps
18 11 (3.94%) OCI
Communications & Networking
1 69 (24.73%) Firewall
2 50 (17.92%) DNS
3 46 (16.49%) VPN
4 34 (12.19%) WAN
5 28 (10.04%) SD-WAN
5 28 (10.04%) TCP/IP
6 27 (9.68%) DHCP
7 19 (6.81%) Network Security
8 14 (5.02%) VLAN
9 11 (3.94%) LAN
9 11 (3.94%) SAN
10 7 (2.51%) Unified Communications
10 7 (2.51%) Wi-Fi
11 5 (1.79%) DMZ
11 5 (1.79%) STUN
11 5 (1.79%) VoIP
12 4 (1.43%) Ethernet
12 4 (1.43%) PuTTY
12 4 (1.43%) Software-Defined Networking
12 4 (1.43%) SSH
Database & Business Intelligence
1 28 (10.04%) SQL Server
2 25 (8.96%) Power BI
3 20 (7.17%) MySQL
4 18 (6.45%) Data Lake
5 10 (3.58%) SQL Server Integration Services
6 9 (3.23%) SQL Server Reporting Services
7 8 (2.87%) Data Warehouse
7 8 (2.87%) Star Schema
8 6 (2.15%) NoSQL
8 6 (2.15%) Relational Database
9 2 (0.72%) Azure SQL Database
9 2 (0.72%) BigQuery
9 2 (0.72%) PostgreSQL
10 1 (0.36%) Big Data
10 1 (0.36%) DB2
10 1 (0.36%) MongoDB
10 1 (0.36%) SQL Server Analysis Services
Development Applications
1 21 (7.53%) Git
2 8 (2.87%) SQL Server Management Studio (SSMS)
3 7 (2.51%) Jenkins
4 4 (1.43%) GitLab
4 4 (1.43%) JIRA
5 3 (1.08%) CircleCI
6 2 (0.72%) Team Foundation Server
7 1 (0.36%) Burp Suite
7 1 (0.36%) Octopus Deploy
7 1 (0.36%) Vagrant
General
1 80 (28.67%) Social Skills
2 62 (22.22%) Finance
3 23 (8.24%) Analytical Skills
4 19 (6.81%) Documentation Skills
5 13 (4.66%) Law
6 9 (3.23%) Public Sector
7 8 (2.87%) Dutch Language
7 8 (2.87%) French Language
7 8 (2.87%) Games
7 8 (2.87%) Legal
7 8 (2.87%) Welsh Language
8 7 (2.51%) Banking
9 6 (2.15%) Telecoms
10 5 (1.79%) Billing
11 3 (1.08%) Advertising
11 3 (1.08%) Inclusion and Diversity
11 3 (1.08%) Local Government
11 3 (1.08%) Presentation Skills
11 3 (1.08%) Public Speaking
11 3 (1.08%) Retail
Job Titles
1 94 (33.69%) Architect
2 37 (13.26%) Cloud Architect
3 33 (11.83%) Infrastructure Engineer
4 32 (11.47%) Cloud Engineer
5 31 (11.11%) Senior
6 28 (10.04%) Lead
7 27 (9.68%) Support Engineer
8 25 (8.96%) Azure Engineer
8 25 (8.96%) Solutions Architect
9 21 (7.53%) Infrastructure Support
10 17 (6.09%) Security Architect
11 16 (5.73%) 3rd Line Support
12 15 (5.38%) IT Architect
12 15 (5.38%) Lead Architect
13 12 (4.30%) Senior Architect
13 12 (4.30%) Server Engineer
14 11 (3.94%) Developer
14 11 (3.94%) Enterprise Security Architect
14 11 (3.94%) IT Engineer
15 10 (3.58%) Applications Support
Libraries, Frameworks & Software Standards
1 15 (5.38%) .NET
2 10 (3.58%) SAML
3 8 (2.87%) REST
3 8 (2.87%) SOAP
4 7 (2.51%) ARM Templates
5 6 (2.15%) Middleware
6 5 (1.79%) 802.1X
6 5 (1.79%) FreeSWITCH
6 5 (1.79%) RESTful
6 5 (1.79%) YAML
7 2 (0.72%) LAMP
7 2 (0.72%) LAPP Stack
7 2 (0.72%) LDAP
7 2 (0.72%) Node.js
8 1 (0.36%) .NET Framework
8 1 (0.36%) Kafka
8 1 (0.36%) OAuth
8 1 (0.36%) OpenID
8 1 (0.36%) Web Services
8 1 (0.36%) XML
Miscellaneous
1 29 (10.39%) Data Centre
1 29 (10.39%) Public Cloud
2 21 (7.53%) Management Information System
3 16 (5.73%) Cloud Native
3 16 (5.73%) Enterprise Software
3 16 (5.73%) Hybrid Cloud
3 16 (5.73%) NHS
4 11 (3.94%) Clustering
5 9 (3.23%) IoT
6 8 (2.87%) PKI
6 8 (2.87%) Private Cloud
7 7 (2.51%) Driving Licence
7 7 (2.51%) Legacy Systems
8 6 (2.15%) Enterprise Cloud
8 6 (2.15%) Video Conferencing
9 5 (1.79%) BYOD
9 5 (1.79%) Cyber Threat
9 5 (1.79%) Greenfield Project
9 5 (1.79%) Replication
10 4 (1.43%) Cyber Defence
Operating Systems
1 98 (35.13%) Windows
2 74 (26.52%) Windows Server
3 33 (11.83%) Linux
4 10 (3.58%) VMS
5 9 (3.23%) Windows Server 2016
6 6 (2.15%) Windows Server 2012
7 5 (1.79%) Debian
7 5 (1.79%) Unix
7 5 (1.79%) Windows Server 2008
7 5 (1.79%) Windows Server 2019
8 4 (1.43%) AIX
9 3 (1.08%) Mac OS
10 1 (0.36%) Android
10 1 (0.36%) Red Hat Enterprise Linux
10 1 (0.36%) Ubuntu
10 1 (0.36%) Windows 10
Processes & Methodologies
1 94 (33.69%) DevOps
2 68 (24.37%) Agile
3 61 (21.86%) Infrastructure as Code
4 57 (20.43%) Problem-Solving
5 54 (19.35%) CI/CD
6 53 (19.00%) Roadmaps
7 49 (17.56%) Cybersecurity
8 48 (17.20%) ITIL
8 48 (17.20%) Project Management
9 47 (16.85%) Infrastructure Engineering
10 44 (15.77%) Cloud Security
11 42 (15.05%) Migration
12 41 (14.70%) Analytics
13 40 (14.34%) TOGAF
14 36 (12.90%) Continuous Improvement
15 30 (10.75%) Service Management
16 29 (10.39%) Artificial Intelligence
16 29 (10.39%) Waterfall
17 27 (9.68%) Risk Management
18 23 (8.24%) Microservices
Programming Languages
1 80 (28.67%) PowerShell
2 52 (18.64%) SQL
3 32 (11.47%) Bicep
4 31 (11.11%) Python
5 27 (9.68%) Bash
6 14 (5.02%) C#
7 5 (1.79%) Java
7 5 (1.79%) TypeScript
8 4 (1.43%) DCL
8 4 (1.43%) Tcl
9 1 (0.36%) Go
9 1 (0.36%) JavaScript
9 1 (0.36%) Kusto Query Language
9 1 (0.36%) T-SQL
9 1 (0.36%) VB.NET
Qualifications
1 71 (25.45%) Azure Certification
2 35 (12.54%) Security Cleared
3 27 (9.68%) DBS Check
4 25 (8.96%) SC Cleared
5 23 (8.24%) Degree
5 23 (8.24%) Microsoft Certification
6 16 (5.73%) Cisco Certification
7 14 (5.02%) CISSP
8 13 (4.66%) CCNA
9 12 (4.30%) AWS Certification
9 12 (4.30%) DV Cleared
10 11 (3.94%) MCSA
11 9 (3.23%) CISA
11 9 (3.23%) MCSE
11 9 (3.23%) SANS
12 8 (2.87%) CCNP
12 8 (2.87%) CISM
12 8 (2.87%) CRISC
13 7 (2.51%) VMware Certified Professional (VCP)
14 6 (2.15%) FFIEC
Quality Assurance & Compliance
1 31 (11.11%) ISO/IEC 27001
2 17 (6.09%) NIST
3 16 (5.73%) GDPR
3 16 (5.73%) SLA
4 15 (5.38%) Cyber Essentials
5 8 (2.87%) Data Quality
5 8 (2.87%) NIST 800
6 6 (2.15%) IFRS
6 6 (2.15%) IFRS 17
6 6 (2.15%) ISO/IEC 27002 (supersedes ISO/IEC 17799)
6 6 (2.15%) Solvency II
7 5 (1.79%) ISO 9001
8 4 (1.43%) QA
9 3 (1.08%) PCI DSS
9 3 (1.08%) PMO
10 2 (0.72%) NCSC
11 1 (0.36%) Cyber Essentials PLUS
11 1 (0.36%) Sarbanes-Oxley
System Software
1 76 (27.24%) Active Directory
2 34 (12.19%) Hyper-V
3 33 (11.83%) Virtual Machines
4 32 (11.47%) VMware Infrastructure
5 12 (4.30%) VMware ESXi
6 10 (3.58%) Docker
7 8 (2.87%) Virtual Desktop
8 5 (1.79%) Kamailio
9 2 (0.72%) KVM
9 2 (0.72%) Terminal Server
9 2 (0.72%) Xen
Systems Management
1 48 (17.20%) Terraform
2 27 (9.68%) Microsoft Intune
3 21 (7.53%) Single Sign-On
4 15 (5.38%) Ansible
4 15 (5.38%) Kubernetes
5 8 (2.87%) SCCM
6 5 (1.79%) Progress Chef
6 5 (1.79%) Puppet
7 4 (1.43%) Autotask
7 4 (1.43%) CASB
8 3 (1.08%) Active Directory Federation Services
8 3 (1.08%) Failover Clustering
8 3 (1.08%) Jamf Pro
9 2 (0.72%) CFEngine
10 1 (0.36%) Consul
10 1 (0.36%) Grafana
10 1 (0.36%) Packer
10 1 (0.36%) Salt
10 1 (0.36%) SCOM
10 1 (0.36%) WSUS
Vendors
1 134 (48.03%) Microsoft
2 48 (17.20%) VMware
3 22 (7.89%) Databricks
4 19 (6.81%) Meraki
5 15 (5.38%) Cisco
6 11 (3.94%) Veeam
7 10 (3.58%) Salesforce
8 9 (3.23%) Oracle
9 8 (2.87%) Fortinet
10 7 (2.51%) Aruba
10 7 (2.51%) Palo Alto
10 7 (2.51%) SAP
11 6 (2.15%) Duck Creek
11 6 (2.15%) Google
11 6 (2.15%) Guidewire
11 6 (2.15%) HP
12 5 (1.79%) CrowdStrike
12 5 (1.79%) EMC
13 4 (1.43%) Forcepoint
13 4 (1.43%) TOWER Software